
Wrightsville Beach STR Market Report 2026: An Island Year

Cross the drawbridge from Wilmington and the market changes before the skyline does. Wrightsville Beach is four miles of barrier island — Harbor Island, the Loop, Masonboro Sound on one side and open ocean on the other — and it has never behaved like the city it borders. Hosts who buy or list here on Wilmington logic, or worse, on Outer Banks logic borrowed from a different coastline three hours north, end up pricing and marketing a town that doesn't exist.
This report treats Wrightsville Beach as its own line item, because that's what the data insists on. AirROI's most recent pull puts the island at roughly $50,596 in typical annual revenue across 512 active listings, for the window running August 2025 through July 2026, page updated August 8, 2026 and re-checked here September 1, 2026. That figure is close enough to the $50,592 figure carried in earlier planning notes that the two can be treated as the same story told twice — call it approximately $50,600 and move on to what actually matters: how that revenue is built, and where it thins out.
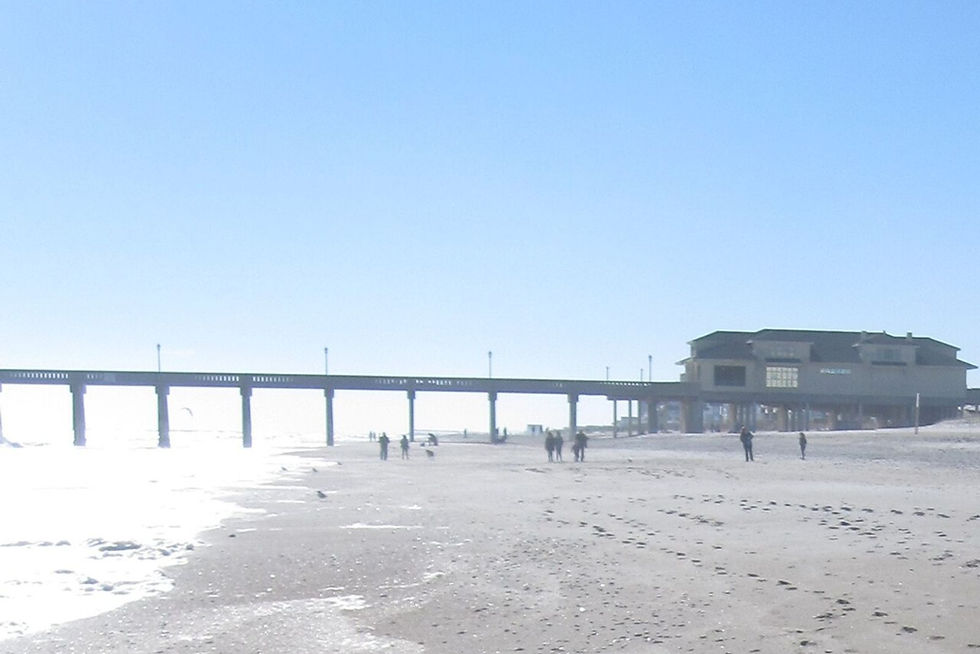
The geography does a lot of the explaining on its own. Wrightsville Beach is walkable end to end, anchored by Johnnie Mercer's Pier at the north end, with the Loop — the paved path that circles the town's core — running through the middle of daily foot and bike traffic. Masonboro Island, the undeveloped barrier island to the south, sits across an inlet and shapes how guests think about the town: a compact, self-contained beach community, not a suburb of Wilmington and not a stretch of the Outer Banks chain. A listing's marketing should sound like that geography, because the data below shows guests are already booking with a specific, planned trip in mind — not drifting in off a highway exit.
None of that makes Wrightsville Beach a simple market to read. It's small enough that a few hundred listings can move the occupancy average meaningfully, compact enough that a walkable Loop and a single pier become genuine differentiators rather than marketing filler, and expensive enough on a nightly basis that the difference between a full calendar and a half-empty one is the difference between a strong year and a mediocre one. The sections below walk through what the current AirROI extract actually says, town by town and month by month, so a host or buyer can plan against this island's real shape instead of a borrowed one. This is not legal advice.
The number, and the number it isn't
$50,596 a year, occupancy 35.2%, average daily rate $563, RevPAR $198. Those four figures come from the same AirROI extract and they need to be read together, not separately, because occupancy and rate are pulling in opposite directions here. A 35.2% occupancy rate is not a booked-out island. It's a market where roughly two nights in three sit empty, carried by a rate high enough to make the annual math work anyway.
That's a materially different shape than the market next door. Wilmington proper — the city across the bridge, not the beach — runs an AirROI figure of $25,881 a year across 1,613 listings, with occupancy of 40.7% and ADR of $228. Wilmington books more often and charges roughly a third of Wrightsville Beach's rate. Filing Wilmington's occupancy pattern onto a Wrightsville Beach listing, or Wilmington's price point onto a Wrightsville Beach forecast, produces a number that belongs to neither town.
Carolina Beach, a separate barrier-island market south of the Cape Fear River mouth, comes in at $32,281 a year across 1,720 listings — its own line, not a stand-in for Wrightsville Beach's mean. And Nags Head, on the Outer Banks proper, sits at $39,866 across 890 listings under this vintage. If an older Nags Head figure near $47,000 is still floating around from a prior cycle, retire it — this year's Nags Head number runs under Wrightsville Beach, not the other way around, and neither town's Outer Banks identity belongs on this island.
The reason this distinction matters is that occupancy and rate tell two different halves of a pricing story, and a host who only reads one half will misprice the calendar in a specific, predictable direction. High ADR with moderate occupancy usually means a market where guests are willing to pay for a specific week but aren't filling every week of the year — which is exactly what the RevPAR figure of $198 confirms once it's set against the $563 headline rate. RevPAR, not ADR, is the number that reflects what a listing actually earns per available night once the empty nights are counted, and on Wrightsville Beach that number is roughly a third of the nightly rate a guest sees advertised.
Why occupancy is the real story here
A market with a $563 ADR and 35.2% occupancy is telling a specific story: demand is real but concentrated, and the calendar has a hard floor under it in the off months. AirROI's data shows June as the peak revenue month in this sample, with January reading as the lowest, and January, February, and December forming the softest stretch of the year. That's a compressed high season sitting on top of a genuine winter trough — not a year-round beach town with a slow week here and there.
The occupancy figure also explains why revenue and rate can move in different directions from what a host expects. in this sample, year-over-year revenue moved -3.8% while supply — the count of active listings — grew 7.6%. More listings competing for a demand pool that isn't expanding at the same pace tends to show up first in occupancy, and only later in rate, because most hosts cut nights before they cut price. Anyone reading this market off ADR alone is reading half the page.
That sequencing matters for how a host should interpret a slow month. A booking calendar that looks thin in, say, March isn't automatically a sign the rate is wrong — on a market with this occupancy profile, thin shoulder months are the baseline, not the exception. The mistake is treating every empty week as a pricing problem to be solved with a discount, when the underlying pattern is a compressed peak and a real trough that no reasonable discount fully closes. The response that actually moves the needle is matching the offer to the calendar — different messaging, different minimum stays, and different target guests in January than in June — rather than running one pricing strategy year-round and wondering why it only works four months out of twelve.
Booking behavior: guests plan this trip
AirROI's lead-time data for Wrightsville Beach shows guests booking roughly 77 days out on average. That's a long runway compared to a spontaneous weekend market, and it matters for how a listing should be marketed: this is a household planning a beach week, not a couple deciding on Thursday to drive two hours on Saturday. Photography, the description, and the calendar need to be finished and accurate well before the booking window opens, because a listing that's still being fixed in April is missing bookings that were decided in February.
That planning horizon also means shoulder-season pricing has to be set early. A host who waits until March to figure out what January and February should cost has already missed the guests who lock in a winter trip during that same long lead window.
A 77-day average lead time also changes what a listing's first impression needs to accomplish. A guest booking a beach week in mid-March for a trip in early June has time to compare several listings, read every review, and study every photo before committing — there's no urgency pushing a fast decision the way a same-week booking would. That means a Wrightsville Beach listing is competing on the strength of its presentation over a longer evaluation window, not winning on being the first result a rushed guest clicks. Weak photography or a vague description doesn't just cost a booking in the moment; it costs the two-and-a-half months of consideration time a serious guest was prepared to give it.
Zoning, not a fee list
Wrightsville Beach's regulatory desk is the Town of Wrightsville Beach Planning & Inspections department, and the operative document is a Certificate of Zoning Compliance, applied for through the town's own Applications and Forms page. This report is not going to hand hosts an guessed fee schedule, because the town hasn't published one to point to here — anyone building a startup budget or a compliance plan needs to pull the current form and current cost directly from the town, not from a secondhand list.
What's worth flagging is the layering. North Carolina's Vacation Rental Act governs the landlord-tenant relationship at the state level, but it is not a substitute for the town's zoning compliance step, and it has nothing to do with New Hanover County or City of Wilmington processes, which are separate desks entirely for anyone who owns outside town limits. This is not legal advice — hosts should confirm zoning compliance directly with Town of Wrightsville Beach Planning & Inspections before listing, and check any HOA or covenant restrictions on their own deed, which this report has no basis to describe.
This distinction trips up more buyers than the market data does. A property under contract in Wrightsville Beach sits inside town limits and answers to the town's own zoning compliance process; a property a few streets away that reads as "greater Wilmington" on a real estate listing may actually sit under New Hanover County's overlay instead, with a different desk and potentially different rules entirely. The AirROI figures in this report describe island performance, not island jurisdiction — a buyer should never assume that a strong revenue number on the island automatically means a straightforward path to legal operation on any specific parcel, because that's a zoning question this report is not equipped to answer.
Reading the four towns as one table
Laid side by side, the four AirROI figures in this report tell a coastal North Carolina story that's easy to miss if a host only ever looks at one town at a time. Wrightsville Beach: roughly $50,600 a year, 512 listings, 35.2% occupancy, $563 ADR. Nags Head: $39,866, 890 listings. Carolina Beach: $32,281, 1,720 listings. Wilmington: $25,881, 1,613 listings. Revenue drops and listing counts rise almost in lockstep moving down that list — the smaller, higher-rate barrier-island markets outearn the larger, lower-rate metro and mainland-adjacent markets on a per-listing basis, even though they carry far less total listing stock.
That pattern matters for anyone deciding where in the region to put a listing, and it matters for anyone already holding a Wrightsville Beach property who's tempted to benchmark against a bigger, busier neighbor. Wilmington's 1,613 listings and 40.7% occupancy describe a market absorbing volume at a modest rate. Wrightsville Beach's 512 listings and 35.2% occupancy describe a smaller, pricier market that hasn't filled its calendar the way Wilmington has — and doesn't need to, given the rate gap, but also can't assume it will without deliberate marketing.
What rising supply means for a new listing
Supply growing 7.6% year over year on a market of 512 listings works out to roughly three dozen net-new units entering the pool over the period AirROI measured. That's not a flood, but on an island with fixed shoreline and a fixed pier, a fixed Loop, and a finite number of streets between Harbor Island and the south end, thirty-some new listings is a meaningful share of the market a new host is now competing against — all of them presumably launching with fresh photos and an eager pricing strategy of their own.
Combined with the -3.8% revenue movement on the same extract, the practical read for a host entering this market in 2026 is straightforward: assume the calendar has to be earned, not assumed. A generic listing with stock beach photography and a description that could describe any coastal North Carolina town is now competing against more listing stock than it was a year ago, for a demand pool that didn't grow to match. The properties that will clear 35.2% occupancy, let alone beat it, are the ones whose marketing actually sounds like Wrightsville Beach — Masonboro, Johnnie Mercer's Pier, the Loop — and not like a beach town in general.
Common mistakes this data predicts
Read against the numbers above, a handful of host mistakes show up over and over on this island, and each one is visible in the data before it shows up in a booking calendar. The first is pricing the shoulder months as a discounted version of June instead of pricing them for what they actually are — a market defined by a real winter trough, not a slightly cheaper summer. The second is assuming the $563 ADR figure describes every property equally, when it's a market average sitting on top of real variation by location, view, and proximity to the Loop and the pier; a property two blocks off the water is not competing in the same rate tier as one facing the ocean, and pricing it as though it is leaves nights unbooked at a rate the market was never going to pay.
The third mistake is the one this report exists to correct: benchmarking against the wrong town. A host who prices off Wilmington's $228 ADR is leaving money on the table every night of the year; a host who prices off an outdated Nags Head figure near $47,000 is either overconfident about occupancy or underconfident about rate, depending on which side of the comparison they're reading. And the fourth mistake is treating rising supply as background noise rather than a competitive signal — 7.6% more listings chasing a demand pool that shrank 3.8% in this sample means the properties standing still on marketing are the ones most likely to lose nights to a newer, better-presented listing down the street.
Year one versus year three on this island
A new host's first year in Wrightsville Beach and a host's third year rarely look the same, and the difference isn't luck — it's what gets built in between. Year one is typically defined by a learning curve on pricing: a new listing without review history or a track record tends to price conservatively out of caution, then either leaves money on the table during the compressed summer peak or discounts too aggressively during the winter trough because the host hasn't yet seen how firm that floor actually is. The supply and demand figures in this report suggest that caution is understandable but costly — on a market this concentrated around a short peak season, getting peak pricing right in year one matters more than almost any other single decision a new host makes.
By year three, hosts who've stayed engaged with the market typically have two advantages a first-year listing doesn't: a full year-over-year revenue history to price against instead of a market average, and enough review volume that guests booking 77 days out can commit with confidence rather than hesitation. What doesn't change between year one and year three is the island's shape — the peak stays compressed, the trough stays real, and the properties that keep growing revenue are the ones that keep refining their calendar strategy each year rather than assuming last year's pricing plan still fits a market where supply grew another 7.6% in the meantime.
What this means for a listing
The honest read on Wrightsville Beach in 2026: a real, high-ADR barrier-island market carrying a below-fifty occupancy rate, a compressed summer peak, a firm winter trough, rising supply, and softening year-over-year revenue on the most recent extract. None of that is a reason to avoid the market. It's a reason to market it precisely — as its own island, with its own calendar, competing against its own real comps, not against Wilmington's price point or an Outer Banks town's older headline number.
A listing built on borrowed numbers from the wrong town is a listing that either overprices the trough or underprices the peak. Both mistakes are visible in the data above; neither is necessary once a host is working from Wrightsville Beach's own figures. The island rewards specificity — in pricing, in photography, in the words on the listing page — and punishes the generic beach-town copy that treats Wrightsville Beach as interchangeable with whichever coastal town shares its zip code prefix.
Related Reading
More Wrightsville Beach STR Market Report 2026 host reading on desks, calendars, and listing clarity.
How to Market a Wrightsville Beach Stay Without Borrowing Wilmington
Wrightsville Beach Shoulder Season: Price January Like Itself
DIY vs Hire: When a Wrightsville Beach Listing Still Reads Generic
Buying a Wrightsville Beach Rental in 2026: This Year's Range
What It Actually Costs to Start a Legal Wrightsville Beach STR
Financing a Wrightsville Beach Rental: What a Lender Actually Asks
Wrightsville Beach vs New Hanover County: Match the Driveway
Frequently Asked Questions
How much does an Airbnb make in Wrightsville Beach, NC?
AirROI's most recent pull shows a typical Wrightsville Beach short-term rental generating roughly $50,596 a year across 512 active listings, for the window running August 2025 through July 2026. That works out to an average daily rate of $563 against 35.2% occupancy. Individual results vary heavily by property type, location on the island, and how the listing is marketed, so treat this as a market-level figure, not a promise for any one unit.
Is Wrightsville Beach the same market as Wilmington for short-term rentals?
No. Wilmington's AirROI figures run separately — about $25,881 a year across 1,613 listings, with 40.7% occupancy and a $228 average daily rate. Wrightsville Beach charges roughly double Wilmington's rate but books less often, which makes them two distinct markets with two distinct pricing strategies, not one metro area with a shared number.
What is the slowest time of year for Wrightsville Beach rentals?
AirROI data in this sample shows January as the lowest revenue month, with January, February, and December forming the softest stretch overall. June reads as the peak revenue month. Hosts pricing the winter months like a discounted summer week tend to leave nights empty that a shoulder-season strategy would have filled.
How far in advance do guests book a Wrightsville Beach rental?
AirROI's lead-time data shows an average booking window of roughly 77 days. That's long enough that a listing's photos, description, and calendar need to be finished well ahead of peak booking decisions — a host still polishing a listing in spring is missing guests who already locked in a summer trip.
Does Wrightsville Beach require a permit for short-term rentals?
The Town of Wrightsville Beach's Planning & Inspections department handles a Certificate of Zoning Compliance through its Applications and Forms page. This report doesn't carry a specific fee figure because the town hasn't published one for us to cite accurately — confirm the current requirement and any cost directly with the town before listing. This is not legal advice.
Is Wrightsville Beach oversupplied with short-term rentals?
The most recent AirROI extract shows listing supply growing 7.6% year over year while revenue moved -3.8% over the same period. That combination — more competition, softer revenue — is worth watching, though it isn't the same as a market in decline. It argues for sharper marketing and calendar strategy rather than assuming demand alone will carry a new listing.
How does Wrightsville Beach compare to Carolina Beach for rental income?
Carolina Beach's AirROI figure runs at $32,281 a year across 1,720 listings, well under Wrightsville Beach's roughly $50,600. The two are separate barrier-island markets south of Wilmington with their own supply, demand, and pricing dynamics — Carolina Beach's number shouldn't be used to estimate a Wrightsville Beach listing, or vice versa.
Is Wrightsville Beach subject to North Carolina's Vacation Rental Act?
The state's Vacation Rental Act governs landlord-tenant terms for short-term rentals statewide, but it operates alongside, not instead of, the Town of Wrightsville Beach's own zoning compliance process. A host who satisfies the state layer without confirming the town's Certificate of Zoning Compliance has not finished the compliance step. This is not legal advice.
Should I compare Wrightsville Beach to Nags Head or the Outer Banks?
Only carefully. Nags Head's current AirROI figure is $39,866 across 890 listings — under Wrightsville Beach's number for this vintage. If an older Nags Head figure closer to $47,000 is circulating from a prior data cycle, it belongs to a different year, not this one, and shouldn't be used to argue Outer Banks towns are outperforming Wrightsville Beach right now.
What's the biggest pricing mistake hosts make in Wrightsville Beach?
Treating the island's high ADR as proof the calendar sells itself. At 35.2% occupancy, roughly two nights in three go unbooked on the average listing, concentrated around a compressed summer peak and a real winter trough. Hosts who price January like a slightly cheaper June, instead of pricing it for what January actually is, leave nights on the table the data already explains.
Work with Crest & Cove Creative
Wrightsville Beach's $563 average nightly rate looks like a sold-out island until the 35.2% occupancy line shows up. Most of this market's marketing failures start with reading the rate and skipping the rest of the report.
If your Wrightsville Beach listing is priced off a Wilmington comp or a secondhand Outer Banks number, a marketing audit will show exactly where the calendar and the copy are out of sync with this island's actual year. Name the failure mode the guest can check on the listing.
Reach out at crestcove.co or (256) 998-7502.


Comments