
Ashland, VA STR Market Report 2026: The $25,215 Town-Limit Year

Updated: Aug 27

Ashland, Virginia - a town on I-95 and US-1 within Hanover County, home to Randolph-Macon College - publishes an AirROI typical year of $25,215 across 18 listings, for the October 2024 through September 2025 vintage.
ADR on this sample is $161, occupancy is 46.4 percent, and RevPAR isn't published on this specific extract. Year over year is a notably strong plus 15.9 percent, with supply up plus 20.0 percent - both figures worth citing directly given this market's genuinely small, 18-listing sample size.
This is not legal advice. It's a practical market report for an Ashland host, buyer, or lender: what this specific town-limit market actually shows, why its October-2024-through-September-2025 vintage differs from neighboring Richmond-area market, and why Kings Dominion's Doswell location shouldn't be blended into a Town of Ashland underwriting conversation.
The Published Year: $25,215 Across 18 Listings
This market's AirROI sample publishes a typical year of $25,215 across 18 listings, with ADR at $161 and occupancy at 46.4 percent - the core figures a host, buyer, or lender should treat as this specific town's underwriting floor, distinct from any neighboring Hanover County figure.
RevPAR isn't published on this specific extract - worth noting directly rather than estimated or guessed, since an unpublished figure shouldn't be quietly filled in with a guessed number in a buyer packet or underwriting memo.
With only 18 listings underlying this figure, this is a genuinely small sample - meaning a single unusually strong or weak listing can meaningfully shift the overall reported average, more so than in a larger market.
The practical rule: any revenue conversation about an Ashland short-term rental should start from this $25,215 typical year, cited specifically alongside its October 2024 through September 2025 vintage, rather than a differently timed or differently located Hanover County figure.
Say the Vintage Before You Cite the Figure
this sample's specific vintage is October 2024 through September 2025 - genuinely different from the August 2025 through July 2026 vintage used for several neighboring Hanover County market, including Mechanicsville, Glen Allen, and Richmond.
A packet or marketing document that cites Ashland's $25,215 figure alongside an August-through-July header, without noting this vintage mismatch, is quietly mixing two differently timed data pulls - a genuine accuracy problem worth catching before it reaches a lender or buyer.
This vintage distinction also means Ashland's own year-over-year and supply figures (plus 15.9 percent and plus 20.0 percent respectively) describe a different twelve-month window than the equivalent figures for Richmond, Mechanicsville, or Glen Allen on their own later vintage.
The practical rule: state the October 2024 through September 2025 vintage explicitly every time this $25,215 figure or its accompanying occupancy rate appears in a listing, packet, or underwriting document, so nobody downstream mistakenly assumes it shares a timeframe with a neighboring market's more recent data.
Don't Blend Richmond, Mechanicsville, or Glen Allen Into this market
Nearby Hanover-area markets publish their own separate figures on a later, August-2025-through-July-2026 vintage: Mechanicsville at $18,445, Glen Allen at $22,108 across 40 listings, and Richmond at $26,029 across a much larger 1,033-listing sample.
None of these figures should be averaged with, or substituted for, Ashland's own $25,215 typical year - each describes a genuinely separate town-named market, on a separate vintage, with a dramatically different sample size in Richmond's case specifically.
This distinction matters most directly for Richmond, given the scale difference: a 1,033-listing metro sample and an 18-listing small-town sample describe fundamentally different markets, even though Richmond sits only fifteen to twenty minutes south as a driving distance.
The practical rule: cite Mechanicsville, Glen Allen, and Richmond figures only as clearly labeled neighbor-comparison context on their own separate later vintage, never blended into or substituted for Ashland's own $25,215 figure on its distinct October-2024-through-September-2025 vintage.
Peak-3 Is July, March, and February
This market's peak-3 months are July, March, and February, with July as the single peak month - a genuinely specific pattern worth pricing deliberately, notably different from a simple "summer is busy" assumption.
March's presence in this peak-3 lines up with Kings Dominion's Opening Day (confirmed March 21, 2026, on the park's live page, after a December 2025 item had listed March 28) - a genuine, dated reason a guest might choose that specific month, though March was already on this market's peak-3 independent of that date.
February's presence alongside July and March is worth noting specifically since it runs counter to a generic assumption that winter is automatically slow in this region - this market's own data places February among its top three months.
The practical rule: price July as this market's clear single peak, and treat March and February as strong secondary months worth deliberate premium pricing, built around this market's own specific three-month pattern rather than a generic regional seasonal assumption.
April Is the Hole, With June and September Low
April is this market's clearly named softest-revenue month, with June and September sitting in a broader low stretch alongside it - the direct, honest counterpart to the confirmed July-March-February peak-3.
Kings Dominion's fireworks and drone show, scheduled Friday through Sunday from July 10 through August 9, 2026, fall within this market's already-confirmed July peak month - a genuine reason for a specific guest to choose that particular weekend, though July was already strong before this show's schedule is factored in.
This market's average lead time is 26 days, and its average stay length isn't published on this specific extract - worth stating honestly rather than estimated, since an unpublished figure shouldn't be assumed or guessed in a marketing or underwriting document.
The practical rule: price April, June, and September honestly below the confirmed peak-3 rate, and never imply that a park attraction's schedule (Opening Day in March, fireworks in July) independently created those months' strength - both months were already part of this market's peak-3 before those specific dates are factored in.
New York Is the Origin, Richmond Is the Drive
New York is this market's leading guest-origin city according to the published extract, with Richmond serving specifically as the satellite drive - about fifteen to twenty minutes south - rather than the origin of demand.
Domestic travelers make up roughly 96 percent of this market's guest-profile block - a genuinely useful composition detail, though a specific New York-guest percentage isn't published and shouldn't be estimated or guessed in marketing copy.
This origin pattern is worth keeping clearly separate from Richmond's own later-vintage origin data - blending the two into a single generic "Central Virginia" origin story would obscure a genuinely useful, town-specific distinction.
The practical rule: cite New York as this market's own confirmed leading origin city for marketing decisions, name Richmond specifically and only as the satellite drive, and avoid inflating either fact into an ADR or occupancy claim it doesn't itself support.
Composition: Houses, Entire-Home Share, and Minimum Stays
Entire-home listings make up 83.3 percent of this sample, with standalone houses at 50 percent and two-bedroom units as the dominant size - genuinely useful composition detail for a host benchmarking their own property against this market's typical listing profile.
Guest capacity of four is this market's most common tier, at 38.9 percent of the sample - worth factoring into amenity and bedding decisions for a host aiming to match this market's dominant guest-group size.
Minimum-stay settings on this sample show one night as the single most common choice, at 44.4 percent (eight listings), while six listings (33.3 percent) have set a thirty-plus-night minimum - two genuinely different booking-policy approaches coexisting in this small market.
The practical rule: treat this composition data as a benchmark for property type and amenity decisions, and treat the minimum-stay split as evidence that both short-stay and long-stay strategies currently coexist here - neither settings alone constitutes proof of actual occupancy for either approach.
Kings Dominion Is Doswell Geography, Not this market
Kings Dominion sits specifically in Doswell, Hanover County - a genuine nearby attraction and a real reason visitors travel to this broader area, but a physically and jurisdictionally separate location from Town of Ashland itself.
A broker memo or marketing packet that divides the park's visitor headcount by this market's 18 listings, implying some connection to occupancy, is performing a calculation this market's actual extract doesn't support - park attendance and this market's own booked-night data are two separate measurements.
This distinction extends to compliance as well: Town of Ashland's own permit and tax framework, addressed on this cluster's dedicated rules-focused sibling page, is a genuinely separate jurisdiction from whatever framework applies to a Doswell-area property near the park.
The practical rule: name Kings Dominion specifically and accurately as a nearby attraction worth a guest's day trip, while keeping this market's own $25,215 typical year, its town-specific compliance requirements, and its own 18-listing sample entirely separate from Doswell park-area lodging.
Randolph-Macon College as Landscape, Not Occupancy
Randolph-Macon College is a genuine, walkable local landmark worth naming specifically in Ashland marketing copy - parents' weekends, move-in days, and home football games are all real, specific reasons a guest might choose this town over a Richmond-area alternative.
None of these campus-calendar events directly convert into a specific, measurable share of this market's actual occupancy - a busy campus Saturday doesn't itself confirm that a specific week or weekend achieved above-average booked nights on this 18-listing sample.
This market's genuinely small sample size (18 listings) means composition facts like this college presence shouldn't be inflated into an assumed "college town premium" without direct evidence from this market's own actual booking data supporting that specific claim.
The practical rule: name Randolph-Macon specifically as genuine local landscape and a real reason for campus-related visitors to choose this town, while keeping any occupancy or revenue claim tied strictly to this market's own confirmed $25,215 typical year and its named April hole.
Reading a Strong Growth Figure on a Small Sample
A plus 15.9 percent year-over-year figure looks genuinely strong on paper, and it is a real, worth-citing trend - but on an 18-listing sample, that percentage can be meaningfully influenced by a small number of individual properties performing especially well or especially poorly.
Supply growing plus 20.0 percent over the same window means new listings entered this market alongside this revenue growth - worth watching directly, since a market this small can shift meaningfully with just a handful of additional active listings.
A buyer or lender shouldn't extrapolate this specific growth rate indefinitely into future years without direct evidence that the underlying demand driving it (rather than simply a few strong individual properties) is genuinely durable.
The practical rule: cite the plus 15.9 percent year-over-year figure and the plus 20.0 percent supply growth together as real, recent trends worth noting, while treating both with the appropriate caution that a genuinely small 18-listing sample deserves.
What This Report Deliberately Doesn't Claim
This report doesn't predict next year's occupancy or revenue - it describes this specific AirROI sample's trailing performance for the October 2024 through September 2025 window, a meaningfully different thing from a forward-looking guarantee for any individual property.
It doesn't claim every one of the 18 listings underlying this figure achieved exactly $25,215 - individual listing performance within any market sample varies, and on a sample this small, that variance can be substantial.
It doesn't claim that Kings Dominion's Opening Day, its summer fireworks schedule, or Randolph-Macon's campus calendar directly drives a specific, quantifiable share of this market's occupancy - these remain genuine demand-context facts, not measured occupancy drivers.
The practical rule: use this report as an honest, sourced starting point for an Ashland-specific conversation, while recognizing that any individual property's actual performance will depend on factors this small market-wide sample can't fully capture on its own.
Comparing This Report Against a Live Listing
A host reviewing their own current Ashland listing against this report's figures should specifically check whether their own pricing calendar already reflects the confirmed July-March-February peak-3 and April-centered low point, or whether it still runs a flatter, less deliberate rate structure.
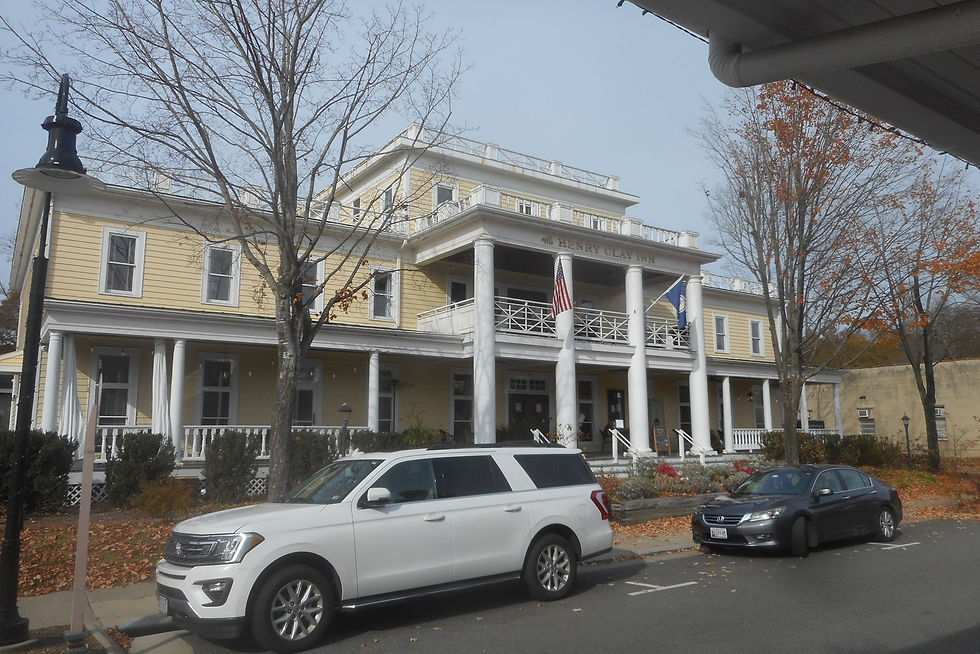
A host should also check whether their own listing description leans on a Richmond downtown framing, or a generic Kings Dominion park-stay pitch, rather than this market's own genuine Main Street and Randolph-Macon identity.
For a host currently underperforming this market's confirmed $25,215 typical year despite the market's overall plus 15.9 percent growth trend, this gap is worth investigating directly - checking pricing, photography, and description against this report's specific findings before assuming the shortfall is unexplainable.
The practical rule: use this report's specific, sourced figures as a direct checklist against a current live listing - peak-3 pricing, April-hole honesty, genuine Main Street and campus-landscape photography, and correct origin-city marketing - rather than as a one-time read with no follow-up action.
What a Buyer or Lender Should Actually Underwrite
A buyer or lender evaluating an Ashland short-term rental property should underwrite from this market's own confirmed $25,215 typical year, its ADR at $161, and its occupancy at 46.4 percent - not from Richmond's much larger $26,029 figure, not from Mechanicsville's or Glen Allen's separate market, and not from an guessed Hanover County-wide blend.
The strong plus 15.9 percent year-over-year growth, paired with plus 20.0 percent supply growth, is genuinely encouraging, but should be read specifically as this small 18-listing market's trend on its October-2024-through-September-2025 vintage, not assumed to continue at the same pace indefinitely.
With only 18 listings underlying these figures, a buyer should specifically seek out property-specific comparable data where possible, since this market's small sample size means the overall average may not precisely describe any individual property's realistic potential.
The practical rule: present this market's $25,215 typical year, its specific October-2024-through-September-2025 vintage, its July-March-February peak-3, and its April hole together as a complete, honest picture - and treat any revenue projection that blends in Richmond's, Mechanicsville's, or Glen Allen's separate figures with direct skepticism.
A lender specifically underwriting a purchase in this market should weigh the genuinely small 18-listing sample size when deciding how much confidence to place in the published average, and may reasonably request additional property-specific evidence before finalizing a loan amount based solely on this market-wide figure.
A Realistic Path Forward for a Small, Growing Market
A plus 15.9 percent year-over-year growth figure on an 18-listing sample is genuinely encouraging, but it doesn't mean every Ashland short-term rental is automatically capturing that same growth rate - individual property performance still depends heavily on pricing, photography, and description quality.
A host currently underperforming this market's confirmed $25,215 typical year, even amid this overall growth trend, should first check the fundamentals discussed throughout this report: accurate peak-3 pricing, honest April-hole expectations, genuine Main Street and Randolph-Macon photography, and correctly sourced New York-origin marketing.
Conversely, a host already pricing deliberately around this market's actual July-March-February pattern, and already marketing this town's own specific identity rather than a borrowed Richmond or Kings Dominion framing, has likely already positioned themselves well within this small, currently growing market.
The most honest, ultimately useful approach for anyone marketing, buying, or evaluating a property here: acknowledge this market's genuinely small sample size directly, price the confirmed seasonal pattern deliberately, and build any revenue expectation from this town's own real, correctly dated data rather than a larger neighboring market's more optimistic figures.
Why This Small Sample Still Deserves a Careful Read
An 18-listing market might seem too small to warrant a full report, but for a host, buyer, or lender specifically evaluating an Ashland property, this remains the most directly relevant data available - far more useful than a larger, differently located metro figure that doesn't actually describe this town.
The specific detail available here - the exact vintage, the named peak-3 and hole months, the origin city, and the composition breakdown - gives a far more actionable picture than a vague "Richmond-area" description would provide on its own.
A host or buyer willing to engage with this level of specific, town-level detail, rather than defaulting to a broader regional assumption, is positioned to make a genuinely more informed decision than one relying on a blended or borrowed figure.
The practical rule: treat this market's small sample size as a reason for careful, specific engagement with its own data - not as a reason to abandon town-specific analysis in favor of a larger, less accurate neighboring market's figures.
Related Reading
Related reading for Ashland, VA hosts: same-town spine first, then nearby geo lines. Skip costume national dumps that do not underwrite this driveway.
Frequently Asked Questions
What is Ashland's actual typical year?
$25,215 across 18 listings for the October 2024 through September 2025 vintage, with ADR at $161 and occupancy at 46.4 percent, genuinely different from Richmond's later-vintage $26,029 figure. That's the number a buyer or host should underwrite from directly, not a blended metro figure pulled from a different reporting period or a much larger sample.
Why does the vintage matter for this market?
Ashland's extract covers October 2024 through September 2025, while Mechanicsville, Glen Allen, and Richmond all report on a later August 2025 through July 2026 vintage. Mixing the two produces an inaccurate comparison, since a market can genuinely shift month to month, and comparing two different twelve-month windows as though they were the same period overstates or understates real change.
Can Richmond's $26,029 figure describe Ashland?
No. Richmond's 1,033-listing metro sample and Ashland's 18-listing small-town sample describe fundamentally different markets, despite Richmond sitting only fifteen to twenty minutes away on I-95. A market roughly sixty times the size of Ashland's, on a different vintage, simply can't stand in for Ashland's own $25,215 typical-year figure.
What are Ashland's actual peak-3 months?
July, March, and February, with July standing alone as the single peak month. February's presence on that list runs counter to a generic assumption that winter is automatically slow in a small Virginia town, and it's a pattern that comes directly from this market's own 18-listing extract rather than a regional seasonal template.
Does Kings Dominion's Opening Day create March's peak-month status?
No. March was already part of this market's confirmed peak-3 independent of the park's March 21, 2026 Opening Day. Opening Day is a genuine reason for a specific guest to book a specific weekend, not the underlying cause of March's overall strength, which shows up across the full month in this market's own data.
Is April really this market's hole?
Yes, with June and September sitting in the same broader low stretch. This is the direct counterpart to the confirmed July-March-February peak-3, and it means a host should plan for three genuinely soft months rather than treating April as an isolated one-month dip that a single rate adjustment can fix.
Where do most Ashland guests come from?
New York is the leading origin city on this market's guest-profile data, with Richmond serving specifically as the satellite drive rather than the source of demand. Richmond sits fifteen to twenty minutes south on I-95 and US-1, but it functions as a nearby city a guest passes through, not as the market feeding Ashland's bookings.
Does Kings Dominion count as this market's occupancy?
No. The park sits in Doswell, a separate Hanover County location from Town of Ashland itself. Dividing park attendance figures by this market's 18 listings doesn't produce a valid occupancy number; occupancy here comes from this market's own confirmed 46.4 percent figure, not from nearby visitor-attraction attendance.
Does Randolph-Macon's campus calendar drive measurable occupancy?
It's a genuine reason for campus-related visitors to choose this town, but with only 18 listings in this sample, that shouldn't be inflated into an assumed premium without direct supporting evidence. The campus calendar fits naturally inside the confirmed peak-3 of July, March, and February rather than functioning as a standalone demand driver.
What should a buyer underwrite for an Ashland property?
The confirmed $25,215 typical year on its specific October 2024 through September 2025 vintage, not a blended Richmond, Mechanicsville, or Glen Allen figure from a different, later reporting period. Underwriting off a neighboring town's number, even one fifteen to twenty minutes away, risks overstating what this specific 18-listing market has actually shown.
Work with Crest & Cove Creative
Ashland's AirROI sample is just 18 listings, and Kings Dominion's Doswell address sits outside the town limits entirely. A listing that borrows theme-park traffic in its copy is marketing to a crowd that isn't actually staying in Ashland.
We help Ashland hosts write listing copy that matches this specific, small town-limit market instead of leaning on Kings Dominion or blended Hanover County language. Send your listing to crestcove.co/audit or call (256) 998-7502.
Reach out at crestcove.co or (256) 998-7502.


Comments