
Brevard vs. Nantahala: Comparing Supply Growth, Demand and Revenue

Updated: 14 hours ago
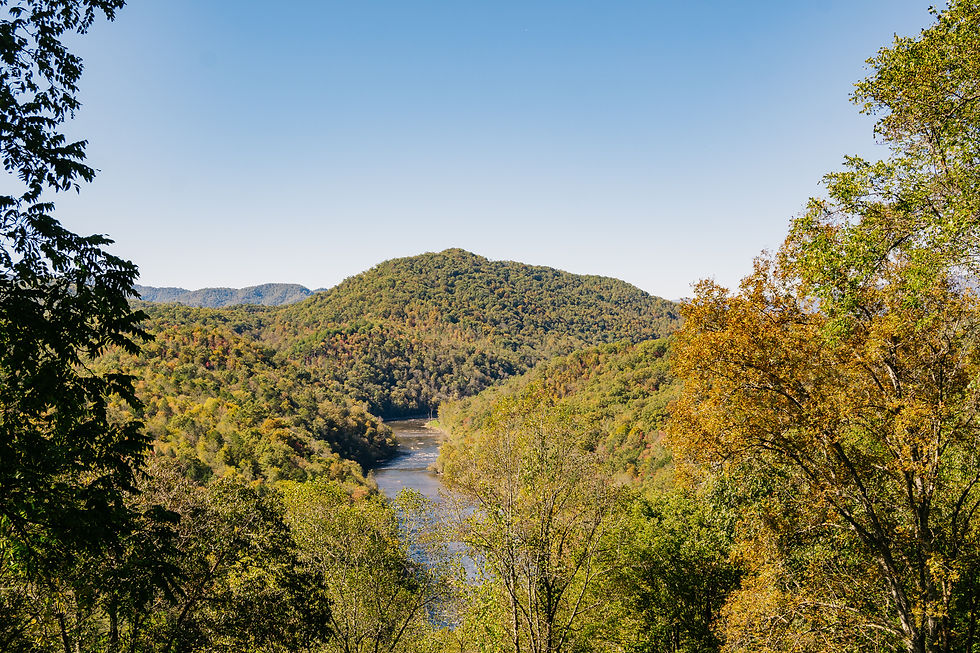
If you’re looking at Western North Carolina as an STR investor, the Brevard vs Nantahala comparison comes up constantly. Both are mountain markets. Both are outdoor-recreation-anchored. Both draw a similar Southeast metro-drive-in audience. On a map, they’re 40 miles apart as the crow flies, and on paper, they look like near-substitutes. In the actual data, they are not.
Over the past three years, the two markets have diverged on the single metric that matters most for a new investor: supply growth relative to demand growth. Brevard has added inventory at a pace that’s starting to compress per-listing revenue. Nantahala has added inventory much more slowly, largely due to land availability constraints, and per-listing revenue has held or grown. This post walks through the numbers and the mechanisms underneath them.
The Markets in One Paragraph Each
Brevard, NC (Transylvania County). Population roughly 7,800. Home of the Pisgah Ranger District, DuPont State Recreational Forest (partially), Looking Glass Falls, and the Brevard Music Center. The waterfall corridor — Transylvania County, which claims the “Land of Waterfalls” with 250+ named falls — is the primary tourism driver. Secondary drivers: Pisgah Forest mountain biking (Pisgah is arguably the best technical MTB riding east of Colorado), fly fishing on the Davidson River, and the music festival.
Nantahala Gorge and Bryson City (Swain County). Bryson City's population is roughly 1,500. The population of Swain County is roughly 14,000. The Nantahala Outdoor Center, the Great Smoky Mountains Railroad, Fontana Lake, and the western Great Smokies national park gateway. Rafting and scheduled Duke Power water releases on the Nantahala River drive the summer engine. Polar Express drives a second December peak.
Supply Growth — The Core Divergence
Per AirDNA and AirROI tracking through Q1 2026, Brevard’s active STR listings grew from roughly 410 in early 2022 to approximately 565 by April 2026. That’s 38 percent supply growth in roughly 48 months, or about 9 to 10 percent annualized.
Over the same window, the Nantahala Gorge and Bryson City market grew from roughly 780 active listings to approximately 873. That’s 12 percent supply growth — or about 3 percent annualized. Almost a third of Brevard’s growth rate.
The reason isn’t mysterious. Swain County has very little developable, road-accessible, private land suitable for new cabin construction. The federal land share of the county is roughly 83 percent — Great Smoky Mountains National Park, Nantahala National Forest, and TVA-controlled Fontana Lake shoreline make up the overwhelming majority of the county’s acreage. New builds happen at the margins, on the remaining 17 percent, and most of the easy-to-develop parcels were built out by 2019.
Transylvania County, by contrast, has a more balanced split between federal/private land. Private parcels with mountain views, stream frontage, or near-Brevard proximity are available and have been permitted briskly. The county has generally been hospitable to STR development, and Brevard itself, while imposing some zoning restrictions, has not imposed a hard cap or a whole-home moratorium the way Asheville did.
Demand Growth — What’s Happening on the Other Side
Demand growth is the other side of the saturation equation. If demand grows faster than supply, more listings are fine. If supply outpaces demand, you get rate compression.
Brevard’s demand growth, measured in booked nights across the market, is up roughly 14 percent over the same 48-month window. The waterfall tourism corridor has grown modestly. Pisgah MTB culture remains strong. But the market hasn’t added a major new attraction or tourism engine — the growth has been gradual, with general interest in Western North Carolina.
Nantahala demand growth over the same window is up roughly 9-11% on booked nights. Slower in absolute terms, but against much slower supply growth, the two curves are closer to balanced. The December Polar Express engine in particular has strengthened. Great Smoky Mountains Railroad ridership has added roughly 5 percent annually since 2019, and the winter ADR peak is now consistently the highest single month of the year.
Brevard: +38% supply vs +14% demand. Supply is clearly outpacing demand.
Nantahala: +12% supply vs +10% demand. Roughly balanced.
What the Divergence Looks Like in Revenue Numbers
The divergence shows up most clearly in RevPAR — revenue per available rental night — and in median per-listing annual revenue.
Brevard RevPAR, 2022 to 2026.AirDNA data shows Brevard RevPAR peaked at around $122 in 2022 and has since drifted to roughly $108 by Q1 2026. Do not keep leftover 57% / 49% / $220 as the Brevard desk. AirROI year is $28,871 at 40.0% because hosts are reluctant to cut rates, but the bookings aren’t filling the extra inventory.
Nantahala RevPAR, 2022 to 2026.The Bryson City/Nantahala RevPAR has moved from roughly $112 in 2022 to approximately $118 in Q1 2026 — a modest gain despite the macro travel slowdown. Do not keep leftover 48–52% / $248 as the Nantahala desk. AirROI Bryson City year is $28,569 at 36.3% over the same window, partly driven by the winter peak and partly by the broader tourism-dollar expansion in Swain County.
In per-listing terms, Do not model leftover $36k / $39k years. AirROI Brevard is $28,871; Bryson City is $28,569. That gap has widened — in 2022 the two markets were within a few hundred dollars of each other.
What This Means if You’re Buying
If you’re evaluating a cabin purchase in 2026 and Brevard and Nantahala are both on your list, the economic comparison tilts meaningfully toward Nantahala. The reasons compound:
One. The supply curve in Nantahala is genuinely constrained by land availability. That’s a durable moat. New investors can’t easily add inventory even if they want to. In Brevard, if the economy improves, new supply will come online and recompress.
Two. Nantahala’s demand base is more diversified — rafting families in summer, Polar Express families in December, honeymoon couples in October, elk-watchers in fall, AT hikers in shoulder seasons. Brevard’s demand is more concentrated in the summer-and-early-fall waterfall/MTB window.
Three. Acquisition pricing in Nantahala is now at parity with or slightly below Brevard on a per-square-foot basis, after being 10 to 15 percent higher in 2021–2022. The market hasn’t fully priced in the revenue divergence yet, which means there’s still a window to acquire.
What This Means if You Already Own in Brevard
If you own property in Brevard, this is not a signal to sell your property. Brevard is a fine market — the revenue is still real, and the lifestyle demand is durable. The saturation data indicate that passive operation is likely to underperform. In a market with 38 percent supply growth and 14 percent demand growth, the listings that will capture bookings in the top third of the market are those that actively differentiate. Passive, generic, family-cabin-with-a-hot-tub positioning has gotten much harder to book profitably.
The top-performing Brevard listings in 2026 are the ones that have niched hard: MTB-specific cabins with gear-wash stations and bike racks near Pisgah; adult-only couples retreats leaning into waterfall-view positioning; large group properties set up for music-festival families around the Brevard Music Center season. Generic mid-size cabins are where the rate compression is falling hardest.
If your listing falls into that generic middle, the move is repositioning — not selling. A Brevard listing that commits to a clear archetype and rewrites the title, photos, and amenity strategy accordingly typically recovers 15 to 25 percent of the revenue lost to market saturation. That’s often the difference between profitable and breakeven.
What This Means if You Already Own in Nantahala
The Nantahala market advantage is real but not indefinite. The three dynamics worth watching:
One. Federal land disposal or right-of-way expansion. Rare but possible. Any material expansion of developable land in Swain County would shift the supply curve.
Two. Swain County or Bryson City is passing a full STR cap (an Asheville-style ordinance). This would freeze the market and make existing permits more valuable — in the short run, a windfall for existing owners. No serious political momentum toward this as of 2026, but worth monitoring.
Three. The Polar Express engine. Great Smoky Mountains Railroad has been a private, family-owned operator for decades. Any ownership or operational change that affected Polar Express scheduling would significantly compress the winter ADR peak that currently underwrites the market.
The listings likely to capture the most upside from the continued Nantahala supply/demand gap are those still priced below-market on the daily rate. If your listing is pulling $185 ADR in a market averaging $248, you’re leaving $4,000 to $9,000 a year on the table even at current occupancy.
The 2027 Scenarios Worth Thinking About
Projecting forward on current trends:
Brevard base case. Supply is expected to grow another 6 to 8 percent to roughly 605 listings by Q1 2027. Demand grows 3 to 4 percent. Median RevPAR drifts down to roughly $100. The market becomes more challenging for passive operators.
Nantahala base case. Supply grows 2 to 3 percent. Demand grows 3 to 4 percent. Median RevPAR drifts up to roughly $122. Market stays tight and continues to reward existing operators.
Brevard bull case. A major new attraction (an expanded music festival footprint, an event center, a major trail system investment) lifts demand by 10+ percent and absorbs the incoming supply. Plausible but not currently visible.
Nantahala bear case. A major event — a bridge closure on US-74, a prolonged Polar Express disruption, or a regulatory change affecting national park gateway access — drives a material reduction in demand. Low probability but non-zero.
The Bottom Line
Two mountain markets, 40 miles apart, with materially different supply-demand trajectories. Brevard is working through the back end of an inventory build-out that demand hasn’t kept pace with. Nantahala is in a quietly enviable position: structurally constrained supply paired with diversified, resilient demand. Neither market is bad. Both can still produce strong returns for the right operator. But the operator profile that wins in each is different, and ignoring that difference is the most common mistake we see when owners move between these markets.
If you’re evaluating a purchase, considering a sale, or just trying to decide where to put your next operational hour, we built the free Crest & Cove visibility audit precisely for this kind of positioning question — market-specific data, listing-specific recommendations, and zero sales pressure.
Frequently Asked Questions
What single metric explains the divergence between Brevard and Nantahala for investors?
Supply growth relative to demand growth over the past three years. Over the past three years, the two markets have diverged on the single metric that matters most for a new investor: supply growth relative to demand growth. But the operator profile that wins in each is different, and ignoring that difference is the most common mistake we see when owners move between these markets.
What's constraining Nantahala's inventory growth?
Land availability constraints, which have kept per-listing revenue holding or growing. Nantahala has added inventory much more slowly, largely due to land availability constraints, and per-listing revenue has held or grown. Brevard has added inventory at a pace that’s starting to compress per-listing revenue. Brevard is working through the back end of an inventory build-out that demand hasn’t kept pace with.
What's happening to Brevard's per-listing revenue by comparison?
Brevard has added inventory at a pace that's starting to compress per-listing revenue. A Brevard listing that commits to a clear archetype and rewrites the title, photos, and amenity strategy accordingly typically recovers 15 to 25 percent of the revenue lost to market saturation. Any ownership or operational change that affected Polar Express scheduling would significantly compress the winter ADR peak that currently underwrites the market.
What's Brevard's population and primary tourism driver?
Roughly 7,800 people, with the "Land of Waterfalls" — 250+ named falls in Transylvania County — as the primary driver. The waterfall corridor — Transylvania County, which claims the “Land of Waterfalls” with 250+ named falls — is the primary tourism driver. Transylvania County tourism overview: explorebrevard.com. The waterfall tourism corridor has grown modestly. Transylvania County, by contrast, has a more balanced split between federal/private land.
What are Brevard's secondary tourism drivers?
Pisgah Forest mountain biking, fly fishing on the Davidson River, and the Brevard Music Center. Secondary drivers: Pisgah Forest mountain biking (Pisgah is arguably the best technical MTB riding east of Colorado), fly fishing on the Davidson River, and the music festival. The top-performing Brevard listings in 2026 are the ones that have niched hard: MTB-specific cabins with gear-wash stations and bike racks near Pisgah; adult-only couples retreats leaning into waterfall-view positioning; large group properties set up for music-festival families around the Brevard Music Center season.
How far apart are Brevard and Nantahala Gorge?
About 40 miles apart as the crow flies. On a map, they’re 40 miles apart as the crow flies, and on paper, they look like near-substitutes. Two mountain markets, 40 miles apart, with materially different supply-demand trajectories. Nantahala is in a quietly enviable position: structurally constrained supply paired with diversified, resilient demand. Private parcels with mountain views, stream frontage, or near-Brevard proximity are available and have been permitted briskly. Keep going on Crest & Cove: Brevard versus Ocoee cabin ROI, Brevard versus Cherokee occupancy against AirROI, the Bryson City AirROI market file, the Crest & Cove intro, local SEO keywords that actually book, Nantahala overlooks worth the drive, Nantahala versus.
What the Divergence Looks Like in Revenue Numbers?
On a map, they’re 40 miles apart as the crow flies, and on paper, they look like near-substitutes. Two mountain markets, 40 miles apart, with materially different supply-demand trajectories. Nantahala is in a quietly enviable position: structurally constrained supply paired with diversified, resilient demand. The listings likely to capture the most upside from the continued Nantahala supply/demand gap are those still priced below-market on the daily rate.
What This Means if You’re Buying?
This post walks through the numbers and the mechanisms underneath them. If you’re evaluating a purchase, considering a sale, or just trying to decide where to put your next operational hour, we built the free Crest & Cove visibility audit precisely for this kind of positioning question — market-specific data, listing-specific recommendations, and zero sales pressure.
Related Reading
Keep reading in the Nantahala market spine and nearby towns in the same region: same-cluster pages hosts can use without costume-corridor copy.
Asheville vs Bryson City: The Seasonal Curve Decides More Than the
Waynesville vs. Ocoee at the Budget Tier: Why a Cheaper Purchase Price
Brevard vs. Blue Ridge GA: Which Market Wins on Repeat Guest Rates?
Nantahala Scenic Overlooks: Fire Towers, the Gorge Rim, and the
Nantahala vs. Blairsville: Two Calendars, Two Very Different
Nantahala Visitor Spend: What the Tourism Dollars Actually Measure
Work with Crest & Cove Creative
Write this town's year. Do not file another market's number as this stay.
Reach out at crestcove.co or (256) 998-7502.



Comments