
Anacortes, WA STR Market Report 2026: The $28,766 Ferry-Town Year

Updated: Aug 27
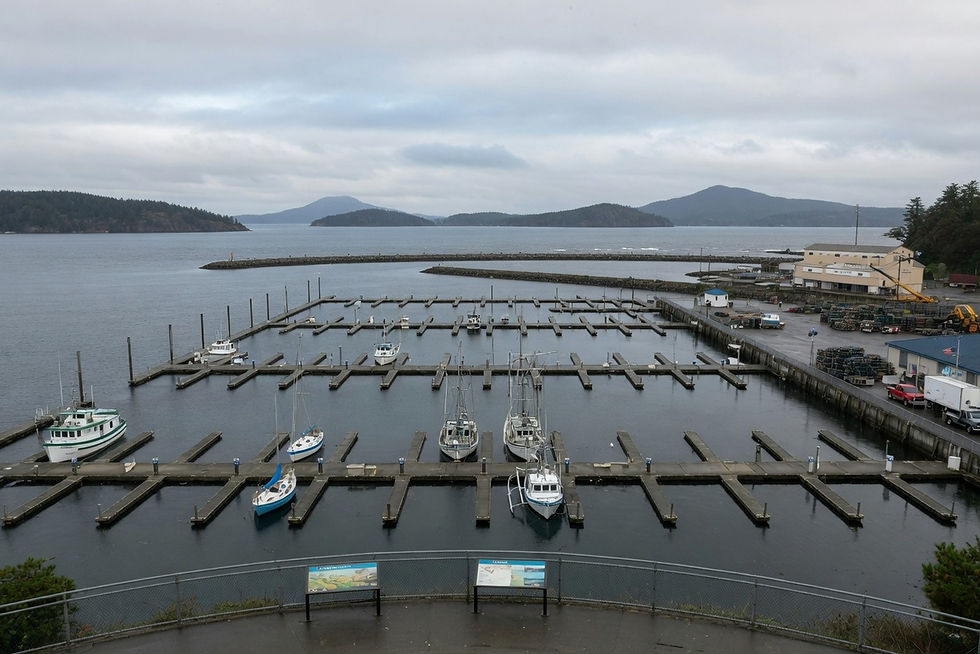
Anacortes, Washington sits on Fidalgo Island in Skagit County, with ferry traffic running toward the San Juan Islands and named local landmarks including Cap Sante, Washington Park, and Old Town.
AirROI's trailing twelve months from August 2025 through July 2026 cover 164 active listings, with a typical year of about $28,766, ADR near $257, occupancy near 43.0 percent, and RevPAR near $110. Revenue is down about 4.1 percent year over year, while active supply held essentially flat.
This is not legal advice. It's a practical market report for an Anacortes host, buyer, or lender: what this 164-listing sample actually shows, which months genuinely carry the year, and why this market's own specific figures shouldn't be blended with a differently located harbor town's data.
The Published Year: $28,766 Across 164 Listings
This market's AirROI sample, covering August 2025 through July 2026, publishes a typical year of about $28,766 across 164 active listings, with ADR near $257 and occupancy near 43.0 percent - the core figures a host, buyer, or lender should treat as this specific market's underwriting floor.
RevPAR (revenue per available night) works out to roughly $110 on this sample - a useful single blended-rate figure for comparing this market against another one, provided both figures come from comparably sized, comparably vintage samples.
This is a genuinely substantial sample size at 164 listings - large enough to read as a real, representative market rather than a handful of outlier properties skewing the average in either direction.
The practical rule: any revenue conversation about an Anacortes short-term rental should start from this $28,766 typical year, cited alongside its specific August 2025 through July 2026 vintage, rather than from a generic Puget Sound or San Juan Islands regional figure.
A Modest Softening, With Supply Holding Flat
This market's year-over-year change sits at minus 4.1 percent, while active listing supply held essentially flat - a genuinely useful combination suggesting this softening reflects rate or demand pressure specifically, rather than a wave of new competing listings diluting the pool.
This distinction matters directly for a host's own strategy: if new supply were flooding the market, a host might reasonably expect increased competition to ease as growth naturally slows. With supply flat, the softening more likely points to demand-side or pricing factors worth addressing directly.
A host or buyer should factor this specific minus 4.1 percent trend into forward-looking revenue expectations, treating it as a real, moderate softening worth watching rather than either ignored entirely or treated as a severe downturn.
The practical rule: cite both the $28,766 typical year and the minus 4.1 percent year-over-year figure together in any underwriting conversation, along with the flat supply context, since together they paint a more complete and honest picture than either figure alone.
Who's Actually Hosting Here
Superhost status covers a notably high 72.0 percent of active listings in this market, while professionally managed listings account for about 22.0 percent - meaning most of this market's 164 listings remain independent owner-hosts rather than large managed portfolios.
Guemes Island Resort is the largest single identified operator in this sample, holding 13 listings - a meaningful but not dominant share, leaving most of this market's competitive landscape open to independent hosts willing to compete on accurate, specific listing copy.
This high 72.0 percent Superhost share suggests a generally experienced host community in this market - worth factoring into competitive strategy, since a new host entering this market is competing against a guest base already accustomed to a high baseline of hosting quality.
The practical rule: an independent host doesn't need to match Guemes Island Resort's scale to compete effectively here - accurate, Fidalgo Island-specific listing copy and genuine local landmark photography remain fully available tools, regardless of a host's individual listing count.
Seasonality: August, June, and May Lead
This market's peak-3 months are August, June, and May, with August as the single busiest month - a pattern that lines up directly with ferry season and summer weather on Fidalgo Island, worth pricing deliberately rather than carrying a flat year-round rate.
A host who treats August like an ordinary shoulder month, pricing it the same as a quieter spring or fall week, is leaving real revenue on the table during the exact stretch this market's own data shows demand is strongest.
This peak-3 pattern also offers a specific marketing opportunity: captioning and photographing these three months for what they actually are - ferry-season, Cap Sante, and Washington Park weather - rather than a generic year-round Pacific Northwest pitch.
The practical rule: build meaningfully premium rates for August, June, and May specifically, and market each month's actual local appeal directly, rather than relying on a flat, undifferentiated calendar.
January Is the Slow Season
January is this market's slowest month for both revenue and occupancy according to the published extract - the direct, honest counterpart to the confirmed August-June-May peak-3 discussed above.
This market's average lead time of about 70 days is a genuinely healthy fall booking window, but it shouldn't be mistaken for evidence that January itself is filling up - lead time and seasonal occupancy remain two separate signals worth reading independently.
A guest's average stay on this sample runs about 5.6 nights - a notably longer stay pattern than many comparable short-term rental markets, worth factoring into January-specific pricing and minimum-stay decisions distinct from the shorter weekend-trip pattern that might characterize peak-season bookings.
The practical rule: plan winter promotions and minimum-stay adjustments deliberately for January specifically, rather than assuming a healthy fall lead-booking window automatically translates into a full winter calendar.
Where Guests Actually Come From
Seattle leads this market's guest-origin demand, with Portland close behind - genuinely useful context for a host thinking about where to focus marketing attention, paid advertising, or drive-and-ferry-logistics messaging.
This origin data describes where guests are traveling from, not this market's actual $257 ADR or 43.0 percent occupancy - a listing shouldn't imply added value or a different pricing tier simply because guests are arriving from a larger nearby metro area.
A single clear sentence addressing drive time and ferry-planning logistics for a Seattle- or Portland-origin guest genuinely helps set accurate expectations, without needing to reframe the entire listing as a big-city day-trip product.
The practical rule: use Seattle and Portland as this market's own confirmed leading origin cities for marketing and advertising decisions, while keeping this fact entirely separate from ADR, occupancy, or rate-setting, which should be based only on this market's own published figures.
Ferry Traffic and Cap Sante Are Landscape, Not Occupancy
Ferry traffic toward the San Juan Islands, and the scenic appeal of Cap Sante, are genuine, worth-naming demand-context features for an Anacortes listing - real reasons a guest might choose this specific town as a base.
Neither of these features is itself a measure of this market's actual booked-night occupancy, which remains 43.0 percent across the full published extract - a busy Saturday at the ferry terminal doesn't itself confirm a filled calendar.
A listing description can and should name Cap Sante, Washington Park, and Old Town specifically and accurately, while keeping any occupancy or revenue claim tied strictly to this market's own confirmed $28,766 typical year.
The practical rule: feature ferry access and Cap Sante's scenery honestly as guest-guide content, and keep this landscape-focused copy clearly separate from any occupancy or revenue claim, which should be sourced only from this market's own published data.
Don't Blend This Market With a Different Harbor Town
This market's own report explicitly warns against blending its own $28,766 typical year with a differently located harbor market's figures, such as Wellfleet - a useful, direct reminder that geographic similarity (a coastal ferry or harbor town) doesn't mean shared market data.
A buyer packet or underwriting memo that averages Anacortes's own figures together with any other town's separately published data, regardless of superficial similarity, is producing a blended number that describes neither market accurately.
This discipline matters specifically because Anacortes's own confirmed 164-listing sample, its own August-June-May peak-3, and its own January hole are all specific to this Fidalgo Island market - genuinely different from another coastal town's own separately confirmed pattern.
The practical rule: cite only this market's own labeled $28,766 typical year, 164-listing sample, and August 2025 through July 2026 vintage in any Anacortes-specific underwriting conversation, and treat any other town's figures as clearly labeled comparison context only.
Where Permits and Compliance Actually Belong
This market report deliberately keeps permit and short-term rental ordinance detail on its own separate sibling page rather than centering compliance walkthroughs in the middle of a market-performance report - a genuinely useful organizational discipline worth preserving.
A host or buyer should still directly confirm current Anacortes short-term rental permit requirements before finalizing any purchase or listing decision - this report describes the published market year and seasonality, not a substitute for that direct compliance confirmation.
Keeping these two categories of information separate - performance data here, and compliance detail on its own dedicated page - makes each easier to find and reference independently, rather than buried within a longer combined document.
The practical rule: use this report specifically for underwriting figures, seasonality, and host-mix data, and consult this market's dedicated rules-focused page directly for permit and ordinance specifics before finalizing any purchase or hosting decision.
Reading Stay Length and Lead Time Together
This market's roughly 5.6-night average stay is notably longer than a typical weekend-getaway pattern, suggesting many guests are planning a genuinely extended Fidalgo Island trip - possibly combined with a San Juan Islands ferry excursion - rather than a quick one- or two-night stopover.
Paired with the roughly 70-day average lead time, this points to a guest base that plans deliberately: booking a longer stay well in advance, likely coordinating around ferry schedules, work calendars, or a broader Pacific Northwest itinerary that includes this market as one stop among several.
A host should build cancellation policies, minimum-stay settings, and even mid-stay guest communication around this longer, more deliberate booking pattern - a policy designed around last-minute one-night bookings would poorly match how this market's actual guests are shown to plan.
The practical rule: set minimum-stay policies and pre-arrival communication around this market's actual confirmed 5.6-night average stay and 70-day lead time, rather than a generic short-term-rental template built around a shorter, more spontaneous booking pattern.
Composition: What Actually Competes on This Sample
With 164 listings underlying this market's published figures, understanding what typically competes here - property type, size, and amenity mix - gives a host or buyer a more precise benchmark than the single blended $28,766 average alone.
A property that differs meaningfully from this market's typical composition, whether in size, waterfront access, or ferry-adjacent proximity, should have its owner weight the blended average accordingly, treating it as a starting reference point rather than a precise prediction for that specific property.
Given Guemes Island Resort's notable 13-listing presence, a host operating independently should specifically benchmark against comparable independent listings where possible, since a single large operator's portfolio may perform differently than the broader independent-host segment of this market.
The practical rule: use the market-wide $28,766 figure as a starting reference point, then adjust expectations based on how a specific property's own size, condition, ferry proximity, and amenities compare to this broader 164-listing sample.
What This Report Deliberately Doesn't Claim
This report doesn't predict next year's occupancy or revenue - it describes this specific AirROI sample's trailing twelve-month performance from August 2025 through July 2026, a meaningfully different thing from a forward-looking guarantee for any individual property.
It doesn't claim every one of the 164 listings underlying this figure achieved exactly $28,766 - individual listing performance within any market sample varies based on location, condition, waterfront access, and management quality.
It doesn't claim that ferry traffic or Cap Sante visitor volume directly drives a specific, quantifiable share of this market's booked occupancy - these remain genuine demand-context facts, not measured occupancy drivers with a precise, calculable contribution.
The practical rule: use this report as an honest, sourced starting point for an Anacortes-specific conversation, while recognizing that any individual property's actual performance will depend on factors this market-wide sample can't fully capture on its own.
Comparing This Report Against a Live Listing
A host reviewing their own current Anacortes listing against this report's figures should specifically check whether their own pricing calendar already reflects the confirmed August-June-May peak-3 and January-centered low point, or whether it still runs a flatter, less deliberate rate structure.
A host should also check whether their own listing description leans on generic Pacific Northwest or San Juan Islands imagery, rather than this market's own genuine, specific landmarks - Cap Sante, Washington Park, and Old Town.
For a host currently underperforming this market's confirmed $28,766 typical year, this report's combination of a modest year-over-year softening and flat supply offers at least a partial, honest starting point for diagnosing whether the issue is market-wide or specific to that individual listing.
The practical rule: use this report's specific, sourced figures as a direct checklist against a current live listing - peak-3 pricing, January honesty, genuine local landmark photography, and accurate origin-city marketing - rather than as a one-time read with no follow-up action.
A Realistic Path Forward for a Modestly Softening Market
A minus 4.1 percent year-over-year trend, especially paired with flat supply, doesn't suggest a market in crisis - it suggests a market experiencing modest rate or demand pressure worth understanding directly rather than ignored or overreacted to.
A host currently underperforming even this modestly softened $28,766 typical year should first check the fundamentals discussed throughout this report: accurate peak-3 pricing, honest January expectations, genuine local landmark photography, and origin-city-informed marketing, before assuming the broader market alone explains any shortfall.
Conversely, a host already pricing deliberately around this market's actual seasonal pattern, and already marketing with Cap Sante and Washington Park rather than generic regional imagery, has likely already captured much of what this specific 164-listing market currently has to offer.
The most honest, ultimately useful approach for anyone marketing, buying, or evaluating a property in this market: acknowledge the modest recent softening directly, price the confirmed seasonal pattern deliberately, and build any revenue expectation from this market's own real, sourced data rather than a more optimistic blended regional figure.
What a Buyer or Lender Should Actually Underwrite
A buyer or lender evaluating an Anacortes short-term rental property should underwrite from this market's own confirmed $28,766 typical year, its ADR near $257, and its occupancy near 43.0 percent - not from a blended Puget Sound regional figure or a differently located harbor town's data.
The modest minus 4.1 percent year-over-year softening, paired with essentially flat supply, deserves direct acknowledgment in any financing conversation - a conservative approach should factor in this recent trend rather than assuming automatic recovery to a stronger historical baseline.
With a substantial 164-listing sample size backing these figures, a buyer can reasonably treat this market's published data as a solid baseline, while still seeking property-specific comparable evidence for a final, precise pricing decision on any individual listing.
The practical rule: present this market's $28,766 typical year, its August-June-May peak-3, its January hole, and its recent modest softening together as a complete, honest picture, and treat any revenue projection that ignores the year-over-year trend, or that blends in a different coastal town's figures, with direct skepticism.
Related Reading
Related reading for Anacortes, WA hosts: same-town spine first, then nearby geo lines. Skip costume national dumps that do not underwrite this driveway.
Frequently Asked Questions
What did a typical Anacortes short-term rental earn in the past year?
AirROI's trailing twelve months from August 2025 through July 2026 show a typical listing earning about $28,766 across 164 active rentals. The average nightly rate was $257, occupancy sat at 43.0 percent, and revenue per available night landed at $110. This sample is large enough to read as a real, representative market rather than a handful of outlier properties skewing the average.
Is Anacortes' short-term rental market growing or shrinking?
Revenue is down about 4.1 percent year over year, while active supply held essentially flat. That combination suggests the softening reflects rate or demand pressure specifically, rather than a wave of new competing listings diluting the pool. A host or buyer should factor this moderate trend into forward-looking revenue expectations rather than treating it as either negligible or a severe downturn.
What's a reasonable revenue benchmark for underwriting an Anacortes property?
The practical rule is to start any revenue conversation from the confirmed $28,766 typical year, cited alongside its August 2025 through July 2026 vintage, rather than a generic Puget Sound or San Juan Islands regional figure. Pairing that number with the minus 4.1 percent year-over-year trend and flat-supply context gives a more honest underwriting picture than either figure alone.
How much of the Anacortes market is run by professional managers versus independent hosts?
Superhost status covers a notably high 72.0 percent of active listings, while professionally managed listings account for about 22.0 percent. That means most of this market's 164 listings remain independent owner-hosts rather than large managed portfolios, even though the guest base is accustomed to a high baseline of hosting quality thanks to that Superhost share.
Who's the largest operator in the Anacortes market?
Guemes Island Resort is the largest single identified operator in this sample, holding 13 listings. That's a meaningful but not dominant share, leaving most of the market's competitive landscape open to independent hosts who compete on accurate, Fidalgo Island-specific listing copy and genuine local landmark photography rather than portfolio scale.
What are Anacortes' peak booking months?
This market's peak-3 months are August, June, and May, with August as the single busiest month. The pattern lines up directly with ferry season and summer weather on Fidalgo Island, which is a genuine pricing and marketing opportunity, since a host who treats August like an ordinary shoulder month is leaving real revenue on the table.
What's the slowest month for Anacortes rentals?
January is this market's slowest month for both revenue and occupancy according to the published extract. It's the direct, honest counterpart to the confirmed August-June-May peak-3, and hosts should plan pricing and maintenance around it as a known low rather than a surprise.
What is RevPAR and why does it matter for Anacortes hosts?
Revenue per available night, or RevPAR, works out to roughly $110 on this sample. It's a useful single blended-rate figure for comparing this market against another one, provided both figures come from comparably sized, comparably vintage samples rather than being pulled from mismatched data windows.
Where exactly is Anacortes located, and does that matter for listing copy?
Anacortes sits on Fidalgo Island in Skagit County, with ferry traffic running toward the San Juan Islands, and named local landmarks including Cap Sante, Washington Park, and Old Town. A listing branded only as generic 'San Juan Islands' skips naming those specific landmarks that actually differentiate a Fidalgo Island stay from a broader regional pitch.
Can Anacortes hosts use this market report as legal or financial advice?
No, this is a practical market report, not legal advice. It's meant to show a host, buyer, or lender what this specific 164-listing sample actually demonstrates, which months genuinely carry the year, and why this market's own figures shouldn't be blended with a differently located harbor town's data.
Work with Crest & Cove Creative
Anacortes' $28,766 typical year comes from a Fidalgo Island ferry-town market of 164 listings, not a generic San Juan Islands gateway. A listing branded only as 'San Juan Islands' skips naming Cap Sante, Washington Park, or Old Town.
We help Anacortes hosts write listing copy around Cap Sante, Washington Park, and Old Town instead of generic ferry-gateway language. Send your listing to crestcove.co/audit or (256) 998-7502.
Reach out at crestcove.co or (256) 998-7502.


Comments