
Algoma, WI STR Market Report 2026: The $15,882 Harbor Year

Updated: Aug 27
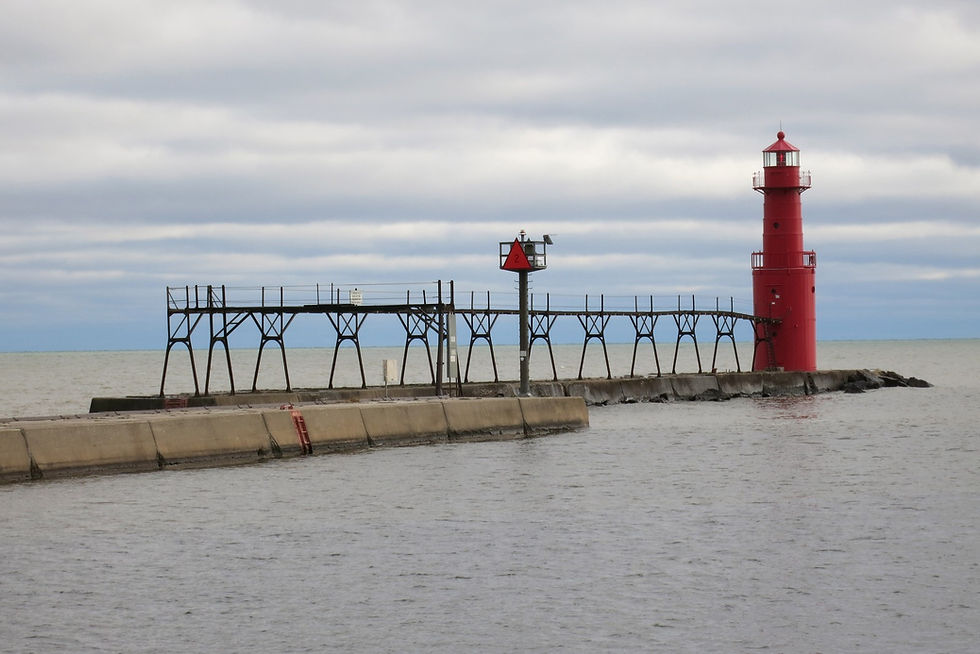
Algoma, Wisconsin - a Lake Michigan harbor city built around the Ahnapee River mouth, the Algoma Pierhead Light, and the Ahnapee State Trail - publishes an AirROI typical year of $15,882 across 41 listings, with ADR near $244, occupancy near 31.1 percent, and RevPAR near $76.
This market's year-over-year figure sits at minus 21.8 percent, a genuinely soft trend worth underwriting honestly rather than papering over with festival-weekend enthusiasm or a borrowed neighbor-city figure.
This is not legal advice. It's a practical market report for an Algoma host, buyer, or lender: what this 41-listing sample actually shows, which months carry the year, and why Kewaunee's separately published $18,551 typical year belongs on its own labeled line rather than blended into this harbor's own numbers.
The Published Year: $15,882 Across 41 Listings
This market's AirROI sample publishes a typical year of $15,882 across 41 active listings, with ADR near $244 and occupancy near 31.1 percent - the core figures a host, buyer, or lender should treat as this specific market's underwriting floor.
RevPAR (revenue per available night) works out to roughly $76 on this sample - a useful single blended-rate figure for quickly comparing this market against a neighboring one, so long as both figures come from comparably sized, comparably vintage samples.
This is a genuinely modest sample size at 41 listings, meaning any individual listing's performance carries real weight in the overall average - a single unusually strong or weak year for one property can meaningfully shift this market's reported figures.
The practical rule: any revenue conversation about an Algoma short-term rental should start from this $15,882 typical year, rather than from a Door County peninsula-wide brochure figure or an guessed blend with a neighboring harbor town.
A Notably Soft Year-Over-Year Trend
This market's year-over-year change sits at minus 21.8 percent - a genuinely significant softening worth acknowledging directly in any pricing or underwriting conversation, rather than glossed over in favor of a single strong festival weekend.
A softening trend like this deserves a direct, honest explanation attempt: whether it reflects broader regional demand softening, increased competing supply, a shift in guest travel patterns, or some combination - rather than an assumption that next year will automatically recover.
A host or buyer evaluating this market should factor this recent trend into forward-looking revenue expectations, rather than relying solely on the historical $15,882 figure as though the market were flat or growing.
The practical rule: cite both the $15,882 typical year and the minus 21.8 percent year-over-year figure together in any underwriting conversation, since the trend line matters as much as the historical average for a buyer evaluating this market today.
Peak-3 Is August, October, and July
This market's peak-3 months are August, October, and July, with August as the single strongest month - a genuinely useful, specific seasonal pattern worth pricing deliberately rather than treated as a flat year-round rate.
October's presence in this peak-3, alongside the more expected summer months of August and July, is worth noting specifically - it suggests fall demand (potentially tied to harbor scenery, fishing season, or fall color) that a host shouldn't overlook when setting an autumn calendar.
Average lead time on this sample is 57 days, with an average stay of 3.7 nights - both genuinely useful booking-shape signals suggesting guests plan a harbor weekend trip a couple of months ahead rather than booking spontaneously.
The practical rule: price August as this market's clear single peak, treat July and October as strong secondary months worth deliberate premium pricing, and build a full-year calendar around this specific three-month pattern rather than a generic "summer is busy" assumption.
February Is the Hole
February is this market's clearly named seasonal low point, sitting within a broader January-through-March low stretch - the honest, direct counterpart to the August-October-July peak-3 discussed above.
A winter ice-fishing season, open-water photography opportunity, or any other seasonal visitor draw doesn't itself convert February from this market's named low point into a filled month - visitor interest and actual booked occupancy remain two separate measurements.
This market's overall 31.1 percent occupancy figure already reflects this seasonal pattern - a host shouldn't expect a thirty-plus-night minimum-stay setting or any other listing-policy change to independently reverse this named winter softness.
The practical rule: price February, January, and March honestly as this market's low stretch, and reserve any winter marketing push for realistic messaging - a quiet, off-season harbor getaway - rather than an implied claim of festival-level winter demand this market's own data doesn't support.
Who's Actually Booking: Milwaukee and Madison
Milwaukee is this market's leading guest-origin city, with Madison as a secondary source - genuinely useful demand-side context for a host thinking about where to focus marketing attention or paid advertising spend.
This origin pattern describes where guests are traveling from, not this market's actual ADR or occupancy figures - a listing shouldn't imply stronger connectivity, amenities, or pricing power simply because guests are arriving from a larger metro area.
It's worth being precise that neighboring Kewaunee's own leading origin city is Chicago, not Milwaukee - a genuinely different guest base from a different metro area, worth keeping separate when planning marketing or advertising strategy specific to each town.
The practical rule: use Milwaukee and Madison as this market's own confirmed leading origin cities for targeted marketing and advertising decisions, while keeping Kewaunee's separate Chicago-origin guest base clearly distinguished in any regional marketing plan.
Kewaunee's $18,551 Is a Different City's Number
Kewaunee, a separate harbor city down the shore in the same general region, publishes its own distinct typical year of $18,551 across 33 listings, with ADR at $252, occupancy at 32.9 percent, and RevPAR at $95 - genuinely different figures from Algoma's own $15,882 and 31.1 percent occupancy.
Kewaunee's own peak-3 (August, July, June) and named hole (April) also differ meaningfully from Algoma's own peak-3 (August, October, July) and hole (February) - two separately confirmed seasonal patterns that shouldn't be blended together despite sharing a general lakeshore region.
Kewaunee's professionally managed share sits at a notably low 12.1 percent, alongside a notably high Superhost share of 72.7 percent, average stay of 4.5 nights, and lead time of 66 days - each of these figures belongs specifically to Kewaunee's own market, not Algoma's.
The practical rule: cite Kewaunee's $18,551 figure only as clearly labeled neighbor-comparison context, never blended with or substituted for Algoma's own $15,882 typical year, regardless of how geographically close the two harbor cities sit to each other.
Door County Is a Different Calendar Entirely
Door County, the well-known peninsula immediately north of this market (including Sturgeon Bay), maintains its own separate tourism identity, seasonal calendar, and presumably its own separate short-term rental market data - genuinely distinct from Algoma's own Kewaunee County location and market data.
A listing description or regional marketing packet that borrows Door County's peak season, visitor volume, or general seasonal framing for an Algoma-specific listing is describing the wrong market's calendar - Algoma's own confirmed peak-3 is August, October, and July, not whatever pattern might apply on the peninsula.
This distinction is especially important given Algoma's own clearly softer year-over-year trend (minus 21.8 percent) - if Door County's tourism volume is genuinely stronger or growing, that's a separate market's story, not evidence that Algoma itself is performing similarly.
The practical rule: keep any Door County or Sturgeon Bay reference clearly labeled as landscape or regional day-trip context, never as a substitute for Algoma's own $15,882 typical year, its own named peak-3, or its own named February hole.
Genuine Local Landmarks Worth Featuring
The Algoma Pierhead Light, the Ahnapee River, the Ahnapee State Trail, and Crescent Beach are all genuine, verifiable local landmarks worth photographing and naming specifically in a listing description - none of this requires a market data figure to be true or compelling.
Shanty Days, this market's named local festival, is worth naming specifically with accurate dates when it falls within a guest's stay - genuine, useful visitor-guide content, distinct entirely from this market's actual $15,882 typical year or 31.1 percent occupancy figure.
Charter fishing, a genuine local activity tied to this harbor's identity, is similarly worth naming as guest-guide content - again, distinct from any occupancy or revenue claim this activity doesn't itself support.
The practical rule: lead marketing copy with the pierhead light, the river, the state trail, and the harbor's genuine small-city identity, while keeping any specific revenue or occupancy figure grounded strictly in this market's own confirmed $15,882 typical year.
Room Tax and Local Compliance Basics
Algoma's room tax rate is 6 percent, established under Chapter 40-24, Ordinance 856, with a specified split directing 70 percent of proceeds to the local chamber and 30 percent to the city - a genuinely useful compliance detail worth confirming directly and keeping current.
This tax remittance obligation applies regardless of a listing's specific minimum-stay setting or seasonal pricing strategy - it's a fixed compliance requirement tied to the act of renting, not tied to whether a specific month happens to fall within this market's peak-3 or its named hole.
A host or buyer should confirm current remittance procedures and any additional local licensing requirements directly with the appropriate Algoma city office, rather than assuming this pass's cited rate and ordinance number remain unchanged indefinitely.
The practical rule: build this 6 percent room tax obligation into any pricing or underwriting model as a fixed cost of doing business in this market, confirmed directly and kept current, independent of whatever seasonal or minimum-stay strategy a specific listing ultimately adopts.
Composition: What Kind of Property Actually Wins Here
With a modest 41-listing sample, understanding the typical property composition in this sample helps a host or buyer benchmark their own specific property more precisely than the blended $15,882 average alone would allow.
A host whose property differs meaningfully from this market's typical composition - in size, capacity, or amenity mix - should weight the blended $15,882 figure accordingly, treating it as a starting reference point rather than a precise prediction for every individual listing.
Comparing a specific property's actual features against whatever composition data is available for this market gives a far more useful benchmark than the single blended average alone, especially in a market this size where outliers carry real statistical weight.
The practical rule: use this market's $15,882 typical year as a market-wide reference point, then adjust expectations up or down based on how a specific property's own size, condition, and amenities compare to the broader 41-listing sample.
Reading Lead Time and Stay Length Together
This market's 57-day average lead time and 3.7-night average stay describe a genuinely specific booking pattern: guests planning a multi-night harbor weekend a couple of months in advance, rather than a last-minute overnight or an extended month-long stay.
A host targeting this specific guest profile should build a booking calendar and cancellation policy around this roughly two-month planning window, since a policy designed for last-minute bookers would poorly fit how this market's actual guests are shown to plan their trips.
This stay-length figure also has direct pricing implications: a nightly rate structure built around three-to-four-night stays should differ from one built around single-night or week-plus stays, since minimum-stay requirements and cleaning-fee amortization both depend heavily on this figure.
The practical rule: set minimum-stay policies, cancellation windows, and nightly-versus-weekly rate structures around this market's actual confirmed 3.7-night average stay and 57-day lead time, rather than a generic short-term-rental template that doesn't reflect this specific booking pattern.
What This Report Deliberately Doesn't Claim
This report doesn't claim to predict next year's occupancy or revenue - it describes this specific AirROI sample's trailing performance, which is a meaningfully different thing from a forward-looking guarantee for any individual property.
It doesn't claim that every one of the 41 listings underlying this figure achieved exactly $15,882 - individual listing performance within any market sample varies, sometimes substantially, based on location, condition, and management quality.
It doesn't claim that Shanty Days, the pierhead light, or any other named local attraction directly drives a specific, quantifiable share of this market's booked occupancy - these remain genuine demand-context facts, not measured occupancy drivers.
The practical rule: use this report as an honest, sourced starting point for an Algoma-specific conversation, while recognizing that a specific property's actual performance will depend on factors this market-wide sample can't fully capture on its own.
Comparing This Report Against a Live Listing
A host reviewing their own current Algoma listing against this report's figures should specifically check whether their own pricing calendar already reflects the confirmed August-October-July peak-3 and February-centered low stretch, or whether it still runs a flatter, less deliberate rate structure.
A host should also check whether their own listing description leans on borrowed Door County or generic Great Lakes imagery, rather than the market's own genuine, specific landmarks - the pierhead light, the Ahnapee River, Crescent Beach, and the state trail.
For a host who has been treating this market's minus 21.8 percent year-over-year softening as a mystery, this report's combination of flat-to-soft demand signals and modest sample size offers at least a partial, honest explanation worth incorporating into a revised pricing strategy.
The practical rule: use this report's specific, sourced figures as a direct checklist against a current live listing - peak-3 pricing, hole-month honesty, genuine local landmark photography, and confirmed room-tax compliance - rather than as a one-time read with no follow-up action.
What a Buyer or Lender Should Actually Underwrite
A buyer or lender evaluating an Algoma short-term rental property should underwrite from this market's own confirmed $15,882 typical year, its ADR near $244, and its occupancy near 31.1 percent - not from a Door County peninsula-wide figure, not from Kewaunee's separate $18,551, and not from an guessed blended regional average.
The genuinely soft minus 21.8 percent year-over-year trend deserves explicit acknowledgment in any financing conversation - a conservative underwriting approach should factor in this recent softening rather than assuming automatic recovery to a stronger historical baseline.
With only 41 listings underlying this market's published figures, a buyer should also seek out property-specific comparable data where possible, since this modest sample size means the overall market average may not perfectly describe every individual property's realistic potential.
The practical rule: present this market's $15,882 typical year, its named peak-3 and hole, and its recent softening trend together as a complete, honest picture - and treat any revenue projection that ignores the minus 21.8 percent trend, or that borrows a stronger neighboring market's figures, with direct skepticism.
A lender specifically underwriting a purchase in this market should also weigh the modest 41-listing sample size when deciding how much confidence to place in the published average, and may reasonably request additional property-specific evidence - a specific comparable listing's own booking history, for instance - before finalizing a loan amount based solely on this market-wide figure.
A Realistic Path Forward for a Softening Market
A minus 21.8 percent year-over-year trend doesn't mean an Algoma short-term rental can't still be a reasonable investment or a successfully operated listing - it means the current pricing and marketing approach deserves a genuinely honest re-examination rather than an assumption that conditions will simply improve on their own.
A host currently underperforming even this softened $15,882 typical year should first check the fundamentals discussed throughout this report: accurate peak-3 pricing, honest hole-month expectations, genuine local landmark photography, and confirmed room-tax compliance, before assuming the broader market itself is entirely to blame.
Conversely, a host already pricing deliberately around this market's actual seasonal pattern, and already marketing with the pierhead light and river rather than borrowed Door County imagery, has likely already captured much of what this specific 41-listing market currently has to offer.
The most honest, ultimately useful approach for anyone marketing, buying, or evaluating a property in this market: acknowledge the recent softening directly, price the confirmed seasonal pattern deliberately, and build any revenue expectation from this market's own real, sourced data rather than a more optimistic borrowed regional figure.
Related Reading
Related reading for Algoma, WI hosts: same-town spine first, then nearby geo lines. Skip costume national dumps that do not underwrite this driveway.
Frequently Asked Questions
What is Algoma's actual typical year?
$15,882 across 41 listings, with ADR near $244 and occupancy near 31.1 percent. This is the underwriting floor for any Algoma short-term rental revenue conversation, not a peninsula-wide or blended Door County figure, and it's the number a host, buyer, or lender should treat as this specific market's baseline.
How soft is Algoma's recent year-over-year trend?
Minus 21.8 percent — a genuinely significant softening worth factoring directly into pricing and underwriting decisions, rather than assumed away in favor of a single strong festival weekend. A host pricing off last year's calendar without accounting for this trend risks overestimating demand across the full year.
Which months make up Algoma's peak-3?
August, October, and July, with August as the single strongest month. October's presence alongside the two summer months suggests real fall demand worth pricing deliberately, rather than folding October into a generic autumn discount the way many nearby markets would.
Is February really this market's hole?
Yes. February sits within a broader January-through-March low stretch. No seasonal visitor attraction or minimum-stay setting has been shown to convert this named low point into filled occupancy, so it's more honest to price it as genuine off-season than to invent a seasonal hook to work around it.
Where do most Algoma guests come from?
Milwaukee is the leading origin city, with Madison second. This differs from neighboring Kewaunee, whose leading origin city is Chicago — two genuinely separate guest bases that shouldn't be blended into one regional visitor profile when writing listing copy.
Can Kewaunee's $18,551 figure describe Algoma?
No. Kewaunee is a separate harbor city with its own distinct typical year, peak-3, and named hole (April). It should only appear as clearly labeled neighbor-comparison context, never blended into Algoma's own $15,882 figure or presented as if it describes this market directly.
Does Door County's tourism volume describe Algoma's market?
No. Door County (including Sturgeon Bay) is a separate peninsula with its own tourism identity and its own market data. Algoma's own confirmed peak-3 and hole shouldn't be replaced by Door County's larger visitor volume or calendar, even though the two are geographically close.
What local landmarks can Algoma hosts market honestly?
The Algoma Pierhead Light, the Ahnapee River, the Ahnapee State Trail, Crescent Beach, Shanty Days, and charter fishing — all genuine, verifiable, and worth featuring regardless of what the market data figures show in any given month.
What's Algoma's room tax rate?
6 percent, under Chapter 40-24, Ordinance 856, with 70 percent directed to the chamber and 30 percent to the city. This applies regardless of a listing's seasonal pricing or minimum-stay strategy, so it should be built into revenue math from the start rather than treated as an afterthought.
What should a buyer underwrite for an Algoma property?
The confirmed $15,882 typical year, alongside the minus 21.8 percent year-over-year trend — both together, not the historical figure alone, and never a borrowed neighboring market's stronger numbers from Kewaunee or Door County.
Work with Crest & Cove Creative
An Algoma listing description that quotes Kewaunee's $18,551 typical year, or skips the market's own minus 21.8 percent trend, is marketing a different town's story to a guest who booked this one. Photos and copy need to match the harbor city, not the neighbor.
We help Algoma hosts write listing copy and positioning from this 41-listing sample's own confirmed numbers, not a borrowed Door County or Kewaunee figure.
Reach out at crestcove.co or (256) 998-7502.


Comments