
McKenzie Bridge Tourism Data: What Actually Predicts Revenue


The McKenzie River, nearby hot springs, and named summer event weekends all generate real visitor interest in McKenzie Bridge, Oregon, and it is tempting to treat that visible tourism activity as a direct stand-in for short-term rental occupancy. This page draws a clear line between the two. River traffic, hot springs visitors, and event-weekend crowds are demand signals worth knowing about, but they are not the same as the confirmed, dated revenue and occupancy figures on the Air ROI extract that actually describes what McKenzie Bridge listings earned.
Typical listings in McKenzie Bridge earned about $31,397 last year, from 50 active rentals on the extract filed for the window running August 2025 through July 2026. Occupancy for that same window came in at about 35.4 percent, with an average nightly rate near $274 and RevPAR around $101. Those four figures, not a description of how popular the river or the hot springs look on a map, are what this page treats as the actual measure of market performance, and every tourism-related claim on this page gets checked against that baseline rather than allowed to stand in for it.
Eugene shows up once here purely for scale: Eugene listings earned about $26,063 last year from 1,328 active rentals on the same extract window. Eugene's tourism draw, largely built around a university city's amenities and events, works on a different logic than McKenzie Bridge's river-and-forest draw, and this page keeps the two figures on separate lines rather than folding them into one regional tourism narrative. This is not legal advice.
The McKenzie River Is Demand, Not a Booked Night
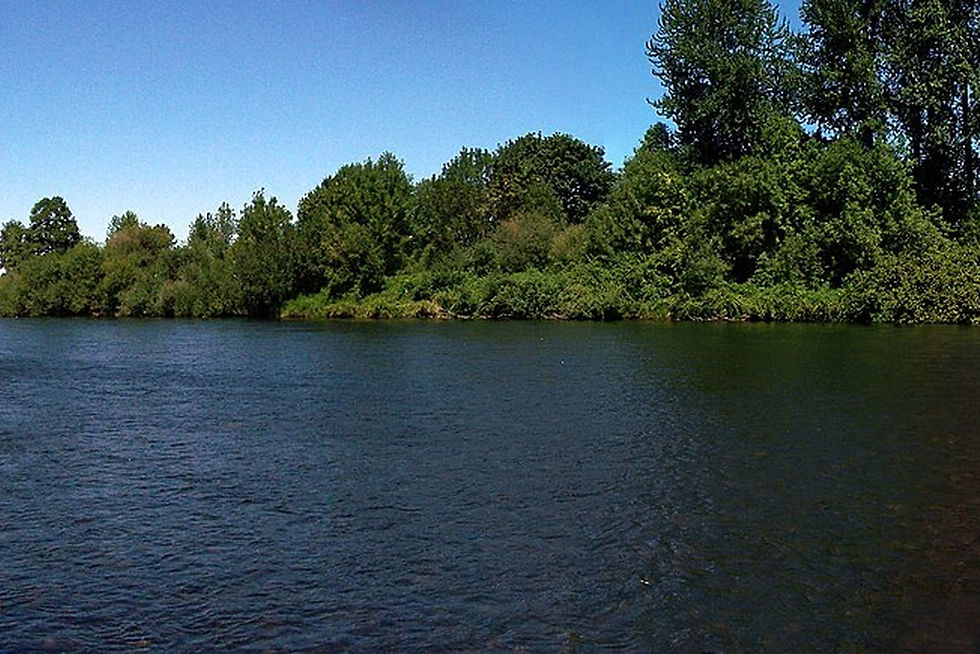
The McKenzie River is the single biggest visible reason people travel to this area, and it is a legitimate driver of guest interest, but it is landscape and recreation access, not a confirmed occupancy figure. A host writing listing copy or a marketing plan should use the river to explain why a guest would want to book, while continuing to price and staff around the extract's actual occupancy number of about 35.4 percent rather than assuming a scenic river view alone pushes occupancy meaningfully higher than what this dataset actually shows for the market as a whole.
This distinction matters most when a host is deciding how much weight to put on river-adjacent positioning versus other differentiators like interior quality, amenities, or pricing discipline. River proximity is a genuine selling point worth featuring prominently in photography and copy, but this sample does not break out occupancy or revenue specifically for river-adjacent listings versus other McKenzie Bridge listings, so a host should not assume river proximity alone guarantees performance above the $31,397 typical-earner figure without other supporting factors in place.
Hot Springs Visitors Are Landscape, Not Occupancy Either
Nearby hot springs draw their own separate visitor traffic, and the same principle applies: hot springs visitor activity is a landscape and recreation-access signal, not a confirmed booking metric in this sample. A listing can reasonably mention proximity to hot springs as one of several draws for the area, but should not treat hot springs visitor counts, if a host encounters them from an unrelated tourism source, as evidence that occupancy in this market runs meaningfully differently than the 35.4 percent figure this sample actually reports.
The risk in leaning too hard on hot springs or river tourism narratives is that it can create pricing expectations disconnected from what the data shows. A host who assumes strong hot springs foot traffic translates directly into strong occupancy might set nightly rates or minimum-stay policies that do not match actual booking behavior, leading to a listing that sits unbooked more often than the market average while priced as if it should be performing above it.
Named Event Weekends Are Demand Signals, Not Booked Nights
Named event weekends in and around McKenzie Bridge generate visible local activity and are worth knowing about for marketing timing, but this sample treats them explicitly as demand signals rather than confirmed occupancy data. A busy-looking event weekend does not automatically mean every nearby short-term rental was booked at capacity; it means demand likely existed, which is a different and weaker claim than a confirmed booked-night figure. This page keeps that distinction intact rather than treating local event buzz as equivalent to the extract's actual occupancy numbers.
Practically, this means a host can and should use named event weekends to inform pricing strategy and marketing timing, adjusting rates upward around known high-demand dates, while still relying on the extract's baseline figures, 35.4 percent occupancy and about $101 RevPAR for the year, as the actual measuring stick for whether a listing is performing at above, or below market. Treating an event weekend as guaranteed occupancy rather than likely elevated demand can lead to overconfident pricing that a listing's actual booking pace does not support.
Keeping Tourism Copy Off the Revenue Line
The core discipline this page asks hosts to apply is straightforward: keep McKenzie Bridge tourism descriptions, the river, the hot springs, named events, out of the revenue line entirely. Tourism copy belongs in listing descriptions, photo captions, and guest-facing marketing material, where it does real work attracting bookings. It does not belong in a revenue projection or an occupancy forecast, where only the extract's actual figures, $31,397 typical annual earnings on 50 listings, $274 ADR, 35.4 percent occupancy, and $101 RevPAR, should be doing the work.
A broker memo, marketing plan, or investment pitch that leans on river photography or event-weekend crowds as if they were occupancy data is substituting a postcard for a spreadsheet. This page is built specifically to prevent that substitution by naming the actual figures clearly and separately from the tourism narrative that surrounds them, so a host or investor reading McKenzie Bridge market material can tell at a glance which claims are backed by the dated extract and which are simply describing what the area looks and feels like to a visitor.
How to Use Tourism Data Correctly in Listing Marketing
Used correctly, tourism data answers a different question than revenue data does: it answers why a guest would choose to book McKenzie Bridge over a comparable destination, not how much revenue a listing is likely to generate. A listing description that opens with river access, nearby hot springs, and the general character of the area is doing legitimate marketing work, provided the host does not then turn around and use that same narrative to justify pricing above what the extract's ADR and occupancy figures actually support for this market.
August stands out as the strongest revenue month in this sample, and that timing lines up reasonably well with peak river and outdoor recreation season, giving a host a defensible reason to lean into river and outdoor imagery specifically during summer marketing pushes. But the underlying justification for that seasonal marketing push should always trace back to the extract's actual peak-month data, August, June, and October, rather than to a general sense that summer is popular; the two usually agree here, but a host should confirm that alignment rather than assume it by default.
Guest Origin and Trip Purpose Shape the Right Tourism Story
Knowing who actually books McKenzie Bridge helps decide which tourism details deserve prominent placement in listing copy. in this sample, most guests arrive from Portland, with Bend as the second-largest origin market, and the typical stay runs about 2.7 nights with a median booking lead time around 64 days. That profile, a short in-state drive audience booking roughly two months ahead for a short stay, points toward weekend and long-weekend leisure trips rather than extended vacations, which should shape how tourism content gets framed: quick access, easy weekend logistics, and immediate outdoor payoff matter more to this guest than amenities suited to a week-long stay.
A listing description built around a two-week itinerary of regional attractions is likely misjudging this audience. A guest with a 2.7-night average stay and a 64-day booking horizon is planning a focused weekend trip, not an extended regional tour, and tourism copy should be edited down accordingly, leading with the one or two draws, river access chief among them, that matter most for a short, high-intent visit rather than attempting to list every attraction within driving distance.
Why Blending Tourism Buzz Into Revenue Projections Backfires
When a marketing plan or investment memo uses river photography, hot springs mentions, or event-weekend crowd descriptions as implicit evidence of strong occupancy, it creates a mismatch between expectation and actual performance that tends to surface at the worst possible time, typically after a purchase has closed or a season's pricing has already been set. A buyer who underwrote a purchase assuming tourism buzz translated directly into occupancy above the extract's 35.4 percent figure may find actual bookings falling short of that assumption, with no clear diagnostic path back to what went wrong because the original projection was never actually anchored to the extract's real numbers in the first place.
The fix is not to stop talking about the river, the hot springs, or local events. Those remain legitimate and valuable parts of a McKenzie Bridge marketing story. The fix is keeping that story in the marketing and guest-facing layer of the business, while every financial projection, every pricing decision, and every revenue expectation stays anchored to the extract's confirmed figures: $31,397 typical annual earnings, $274 ADR, 35.4 percent occupancy, and $101 RevPAR. Two separate documents, a marketing narrative and a financial model, built from two appropriately separate sources, keep a host from accidentally importing tourism optimism into a spreadsheet where it does not belong.
A Practical Checklist for Separating Story From Spreadsheet
Before publishing any piece of McKenzie Bridge marketing content, a host can run a quick check: does this sentence describe why a guest would want to visit, or does it imply how much revenue or occupancy the listing will generate? River access, hot springs proximity, and named event weekends belong firmly in the first category. Statements about expected nightly rate, expected occupancy, or expected annual revenue belong in the second, and those statements should trace directly back to the extract's actual figures rather than to a general impression of how popular the area looks in tourism photography or social media posts.
This same checklist applies when reviewing content written by a property manager, a listing optimization service, or an outside marketing vendor on a host's behalf. If a vendor's pitch deck or sample copy leans heavily on tourism imagery while making specific revenue promises, ask directly what data backs the revenue claim, and whether that data is the same dated, listing-count-specific extract this page relies on, $31,397 typical annual revenue on 50 McKenzie Bridge listings, or a softer regional estimate dressed up to look more precise than it actually is. A vendor unable or unwilling to show the underlying data source for a specific revenue claim is a signal worth taking seriously before committing marketing spend.
The same discipline applies to internal planning documents a host writes for their own use. A pricing spreadsheet, a seasonal calendar, or a renovation budget should cite the extract's actual figures directly in the document itself, rather than a paraphrased or half-remembered version of them. Writing '$31,397 typical annual revenue, 50 listings, August 2025 through July 2026 extract' directly into a planning document, instead of a vaguer note like 'strong revenue potential,' keeps the underlying data traceable months later when the host revisits the plan, updates it for a new season, or shares it with a lender, partner, or property manager who needs to understand exactly what the projection is actually built on.
Related Reading
More McKenzie Bridge Tourism Data host reading on desks, calendars, and listing clarity.
Frequently Asked Questions
Does the McKenzie River guarantee strong occupancy for nearby short-term rentals?
No. The McKenzie River is a genuine draw for visitors and a legitimate marketing point, but this sample treats river traffic as a demand signal, not a confirmed occupancy figure. The actual occupancy figure for McKenzie Bridge in this sample is about 35.4 percent for the year. A host should feature river access in listing copy while continuing to price and plan around the extract's actual occupancy and revenue numbers rather than assuming river proximity alone lifts performance above that baseline.
Should I use nearby hot springs visitor traffic to estimate my occupancy?
No. Hot springs visitor activity, like river traffic, is a landscape and recreation-access signal rather than a confirmed booking metric in this sample. Mentioning hot springs proximity in listing copy is reasonable marketing, but using hot springs foot traffic to justify pricing or minimum-stay decisions risks setting expectations the actual data does not support. Rely on the extract's confirmed occupancy figure of about 35.4 percent and RevPAR of about $101 when making pricing and calendar decisions.
Do named event weekends mean every nearby listing gets fully booked?
Not necessarily. this sample treats named event weekends as demand signals, meaning elevated interest likely exists, not as confirmed full-occupancy data. A busy-looking event weekend is a reasonable cue to raise rates or tighten minimum stays around those specific dates, but it should not be treated as proof that every nearby listing books solid during that window. The extract's actual occupancy and RevPAR figures remain the correct baseline for overall performance expectations.
What is the actual occupancy and revenue baseline for McKenzie Bridge?
Typical listings in McKenzie Bridge earned about $31,397 last year from 50 active rentals on the extract filed for the window running August 2025 through July 2026. Average daily rate ran about $274, occupancy was about 35.4 percent, and RevPAR worked out to roughly $101. These four figures are the actual measuring stick this page uses, separate from tourism narratives about the river, hot springs, or named events that surround but do not replace this data.
Why does this page separate tourism narrative from revenue data so strictly?
Because tourism narrative and revenue data answer different questions and get misused when blended together. Tourism narrative, river access, hot springs, named events, explains why a guest might choose to book McKenzie Bridge. Revenue data, the $31,397 typical-earner figure and the occupancy and rate figures behind it, answers how a listing is actually likely to perform. Treating a strong tourism narrative as if it were confirmed occupancy data leads to overconfident pricing decisions the actual booking data does not support.
Which month shows the strongest revenue on this McKenzie Bridge extract?
August is named as the strongest revenue month in this sample, which lines up reasonably well with peak river and outdoor recreation season in the area. That alignment gives hosts a defensible reason to lean into river and outdoor-recreation imagery specifically during summer marketing pushes. Even so, the underlying justification for seasonal marketing timing should trace back to the extract's actual peak-month data, August, June, and October, rather than to a general assumption that summer is simply the busy season.
How should I compare McKenzie Bridge tourism data to Eugene's?
Eugene listings earned about $26,063 last year from 1,328 active rentals on the same data window, and Eugene's tourism draw is built primarily around a university city's amenities and events rather than a river-and-forest recreation corridor. Those are two fundamentally different demand drivers operating at very different scales. This page keeps McKenzie Bridge's $31,397 figure and Eugene's $26,063 figure on separate lines, and it does not blend either market's tourism narrative into a single combined regional story.
What quiet-hours or house-rule guidance applies to tourism-heavy weekends?
Quiet hours and house rules should be set according to whatever McKenzie Bridge's current confirmed requirements specify, once those are verified at lanecountyor.gov, rather than loosened or tightened casually around a busy event weekend. This page does not have a McKenzie Bridge-specific ordinance dollar figure to cite here, and it points hosts to confirm current rules directly with the county rather than guessing. Do not advertise any occasion or event-adjacent stay type the confirmed local rules do not actually allow the property to host.
Work with Crest & Cove Creative
River views and hot springs proximity explain why guests choose McKenzie Bridge, but only the extract's 35.4 percent occupancy and $101 RevPAR should set your pricing and revenue expectations. Name the failure mode the guest can check on the listing.
Crest & Cove Creative writes short-term rental marketing copy that puts genuine tourism appeal, river access, nearby hot springs, seasonal events, exactly where it belongs, in guest-facing descriptions, without letting that narrative bleed into revenue projections it cannot actually support. If your McKenzie Bridge listing needs marketing copy that sells the destination honestly while your pricing strategy stays anchored to real occupancy and revenue data, our team can help you build both pieces correctly from the start.
Reach out at crestcove.co or (256) 998-7502.


Comments